

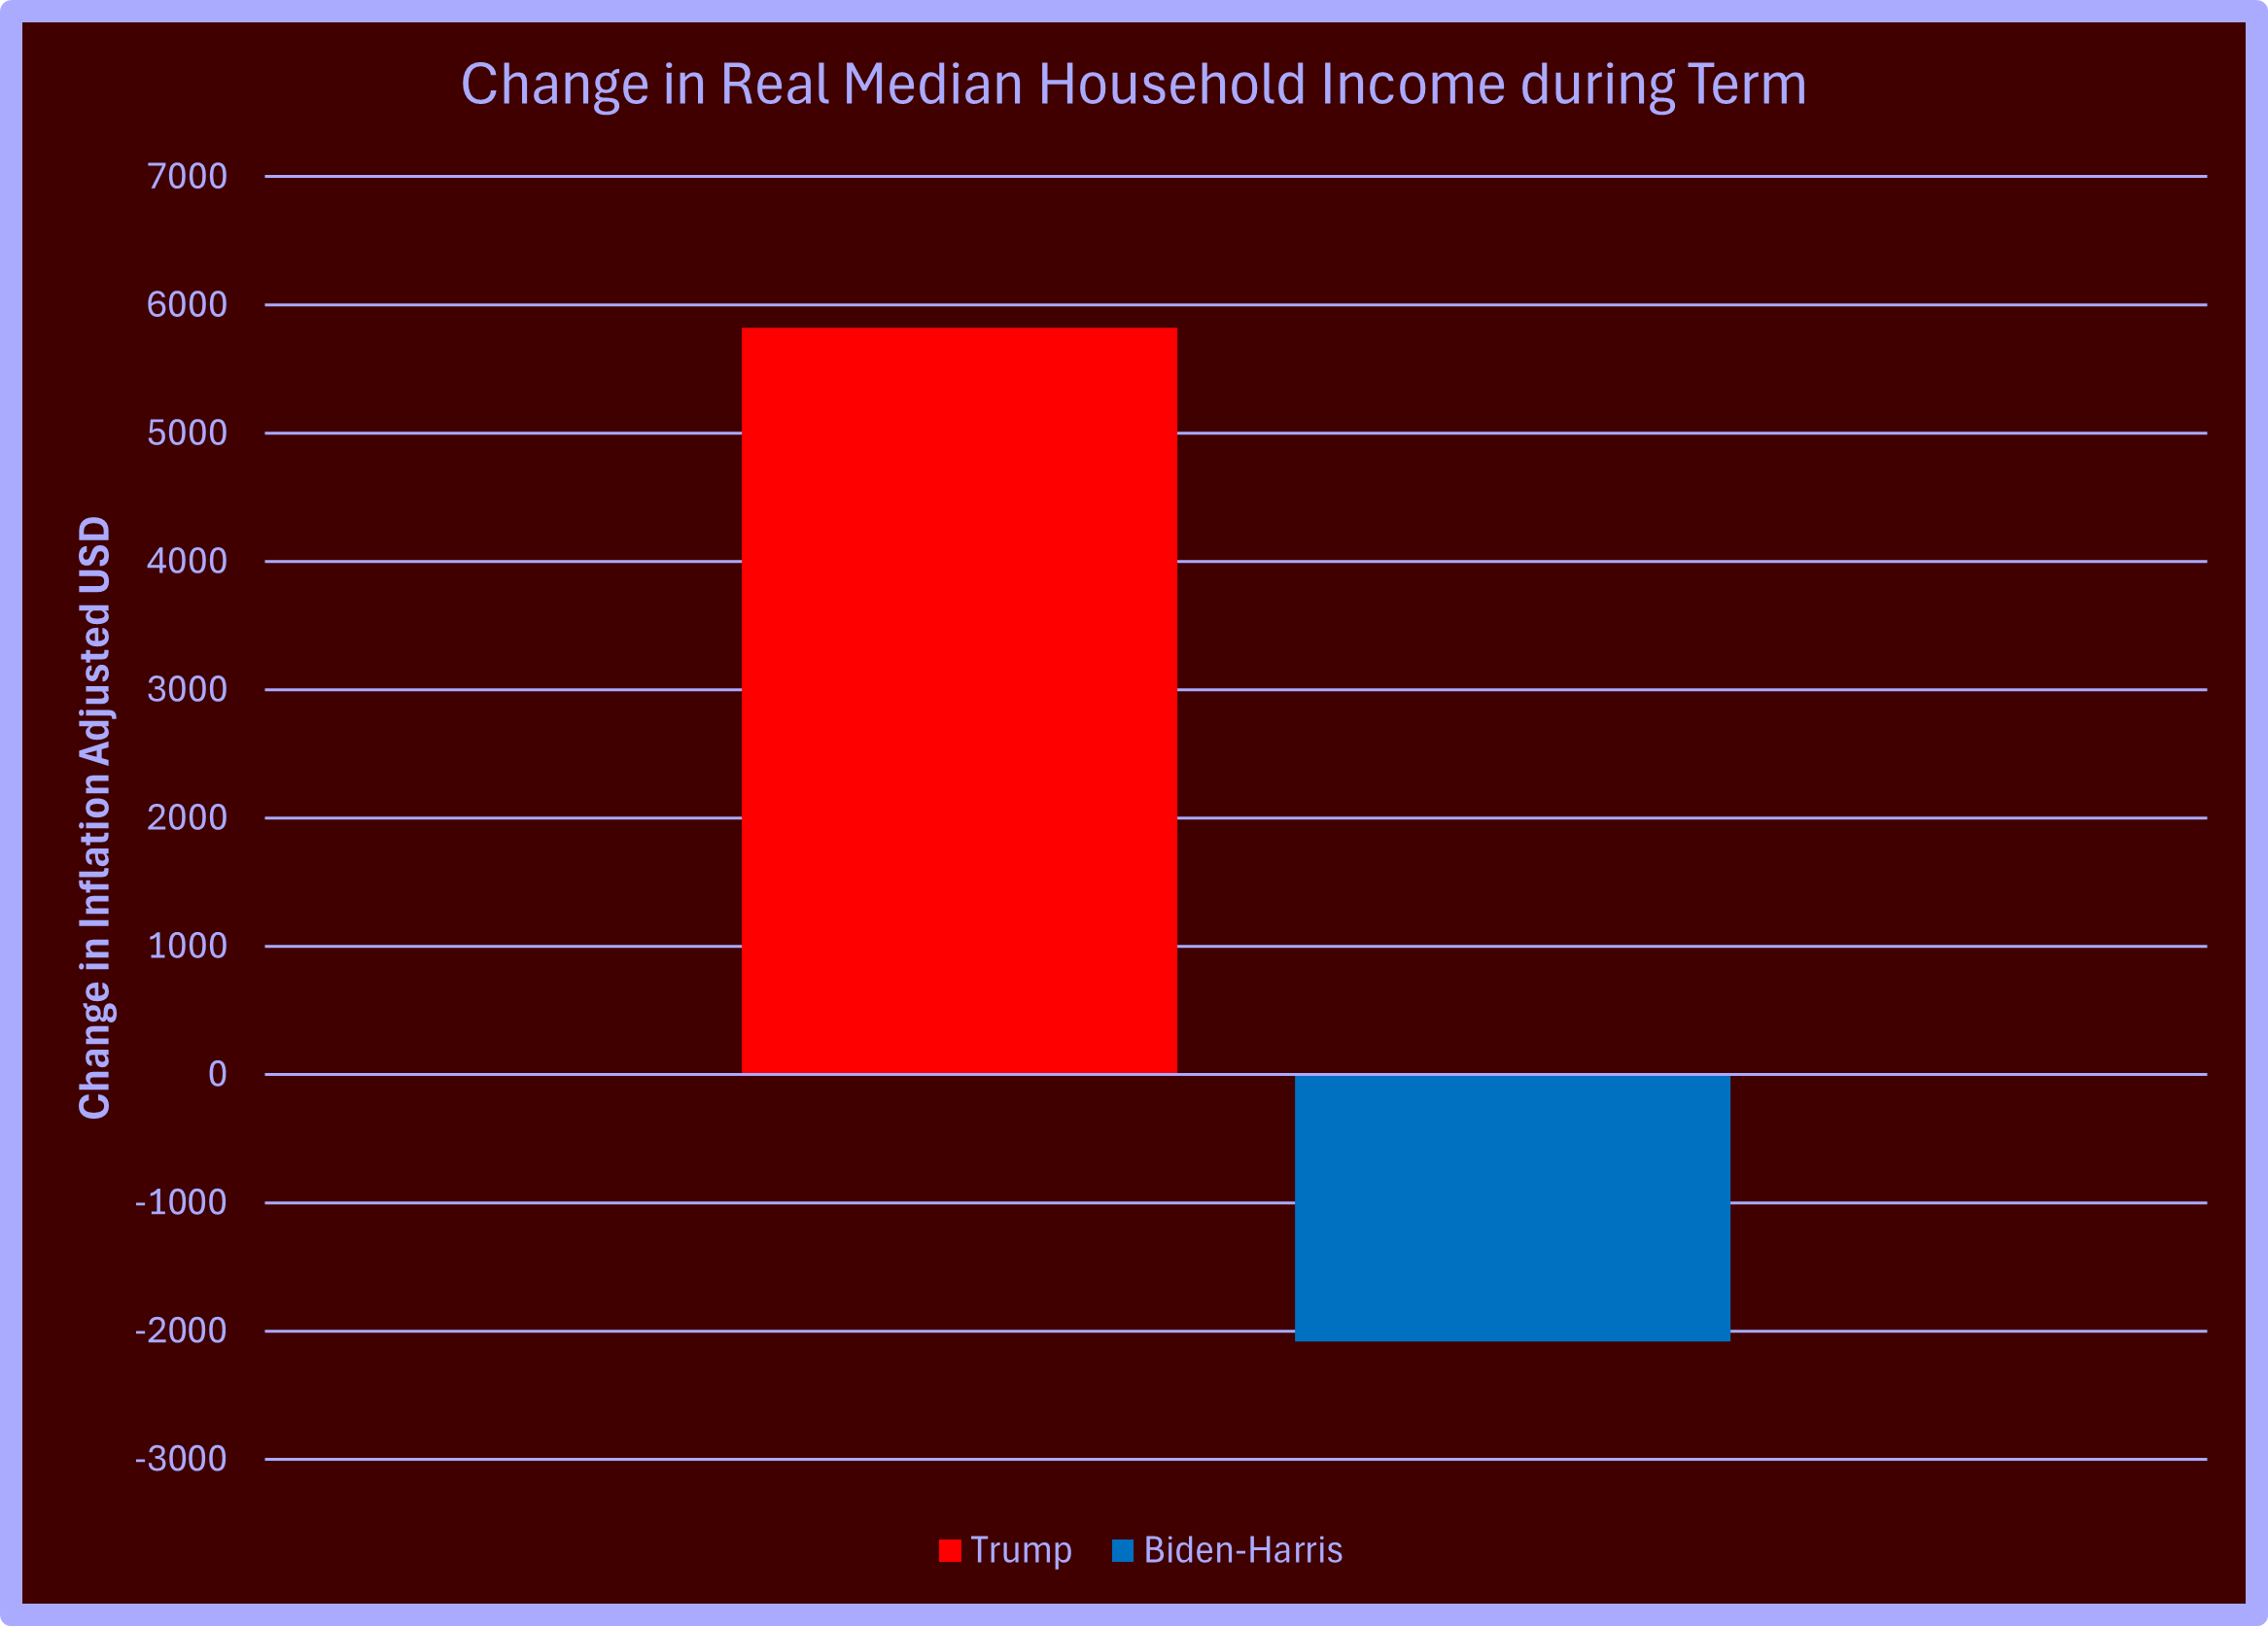
Several readers have suggested that I do a piece comparing the economic plans of the two candidates for President in 2024. I'd love to, but I'm afraid it can't. Neither candidate has a plan with enough specifics to make an economic evaluation possible. Furthermore, neither candidate gives even a nod to the fact that their "plans" are merely proposals that Congress would have to implement with legislation, and neither offers a roadmap for getting that done. Finally, campaign promises are notoriously unreliable, so even if they had done all of the above, it doesn't mean the plans would actualize. I'm an economist; I can't evaluate what a candidate vaguely wishes for and hopes they can move toward. I've already written several articles you can look at to make sense of the economic factors as the result of government economic policies. 'and the winner is...', 'Stagflation', 'Stocks and Inflation', and 'Causes of Inflation'. This article will be even more in-depth. Thankfully, I have a solid basis for comparison. Both candidates have a track record as President or Vice-President that I can analyze. It's reasonable to assume that President Trump would implement policies similar to those during his 2016-2020 term and that Vice-President Harris would continue policies much like those she endorsed from 2020-2024. So, let's delve into the economic performance under President Trump and President Biden with Vice President Harris and see which administration's policies had the most impact on the average American. Let's start with a look at median household income. As you can see in the chart below, household income increased during the Trump term by $5820 and declined by $2080 during the Biden-Harris term. This means that, on average, households saw a significant increase in their income under Trump, while under Biden-Harris, there was a noticeable decrease in income.
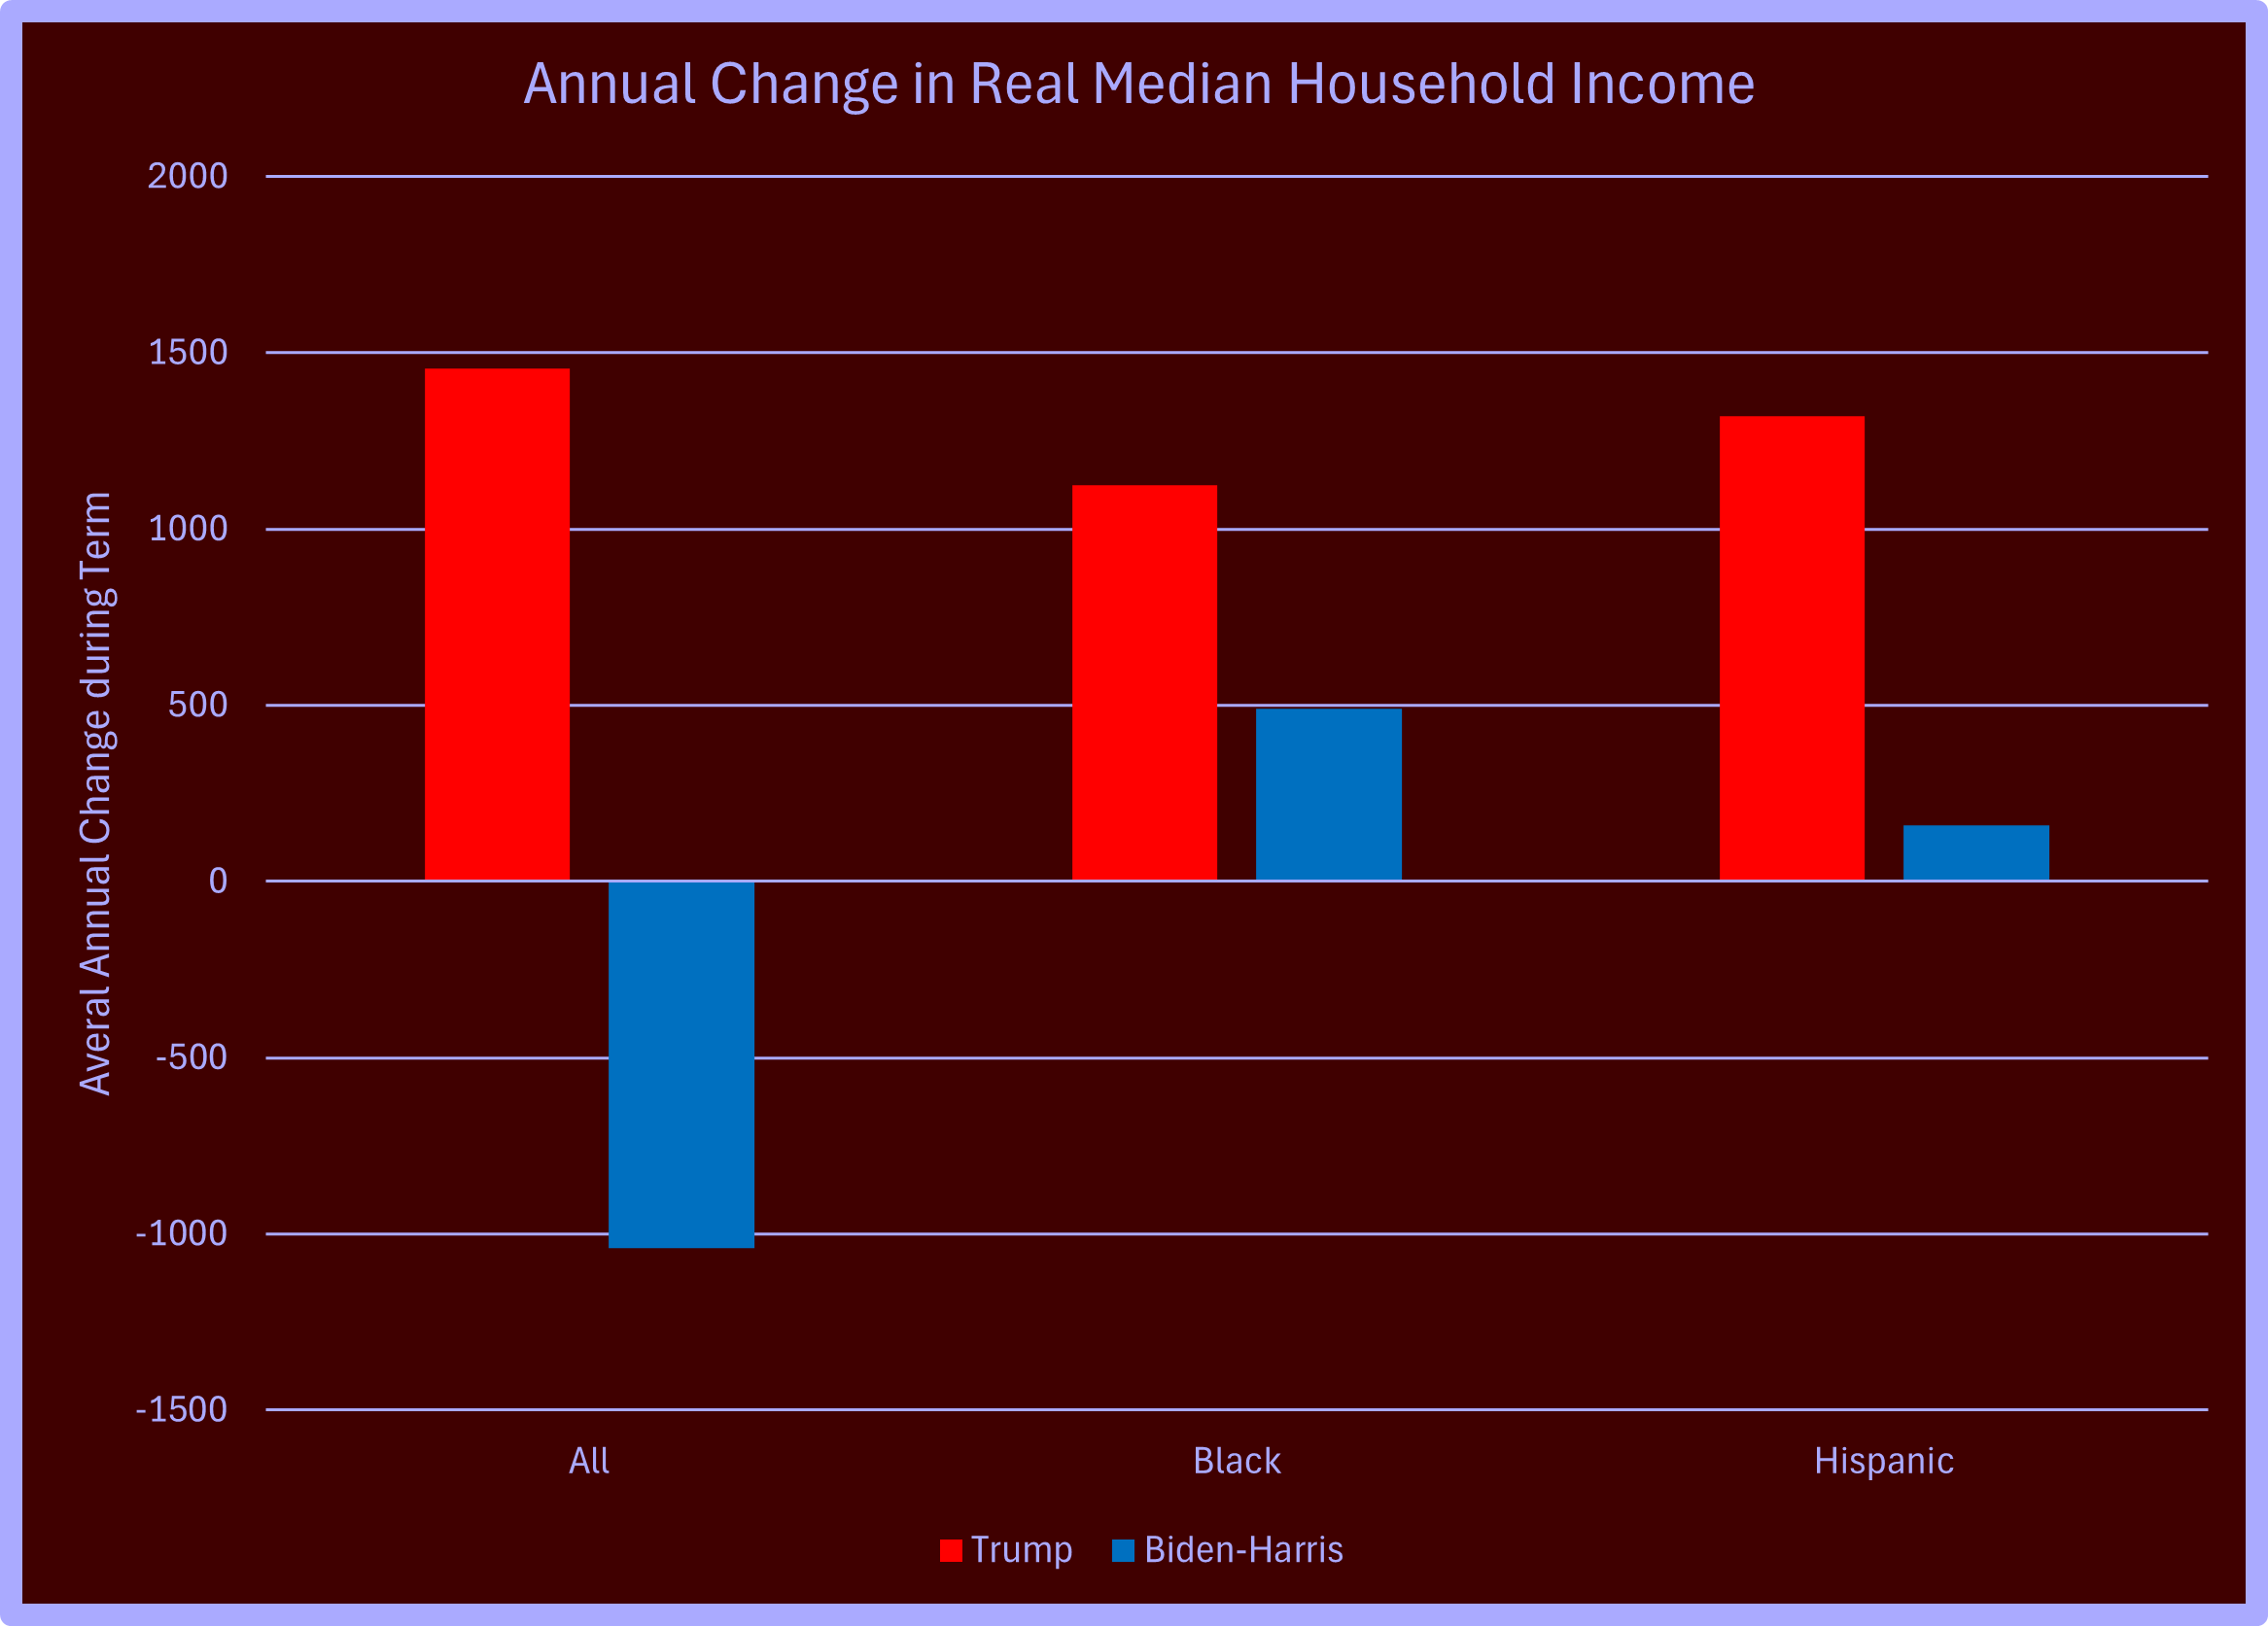
If we break it down ethnically, we find that, on average, each year of the Trump term, increased all groups by $1455, blacks by $1125, and Hispanics by $1320. On the other hand, during the Biden-Harris term, all combined ethnic groups lost $1040, while blacks gained $490, and Hispanics gained $160. Blacks and Hispanics did better than other ethnic groups under Biden-Harris but not nearly as well as under Trump.
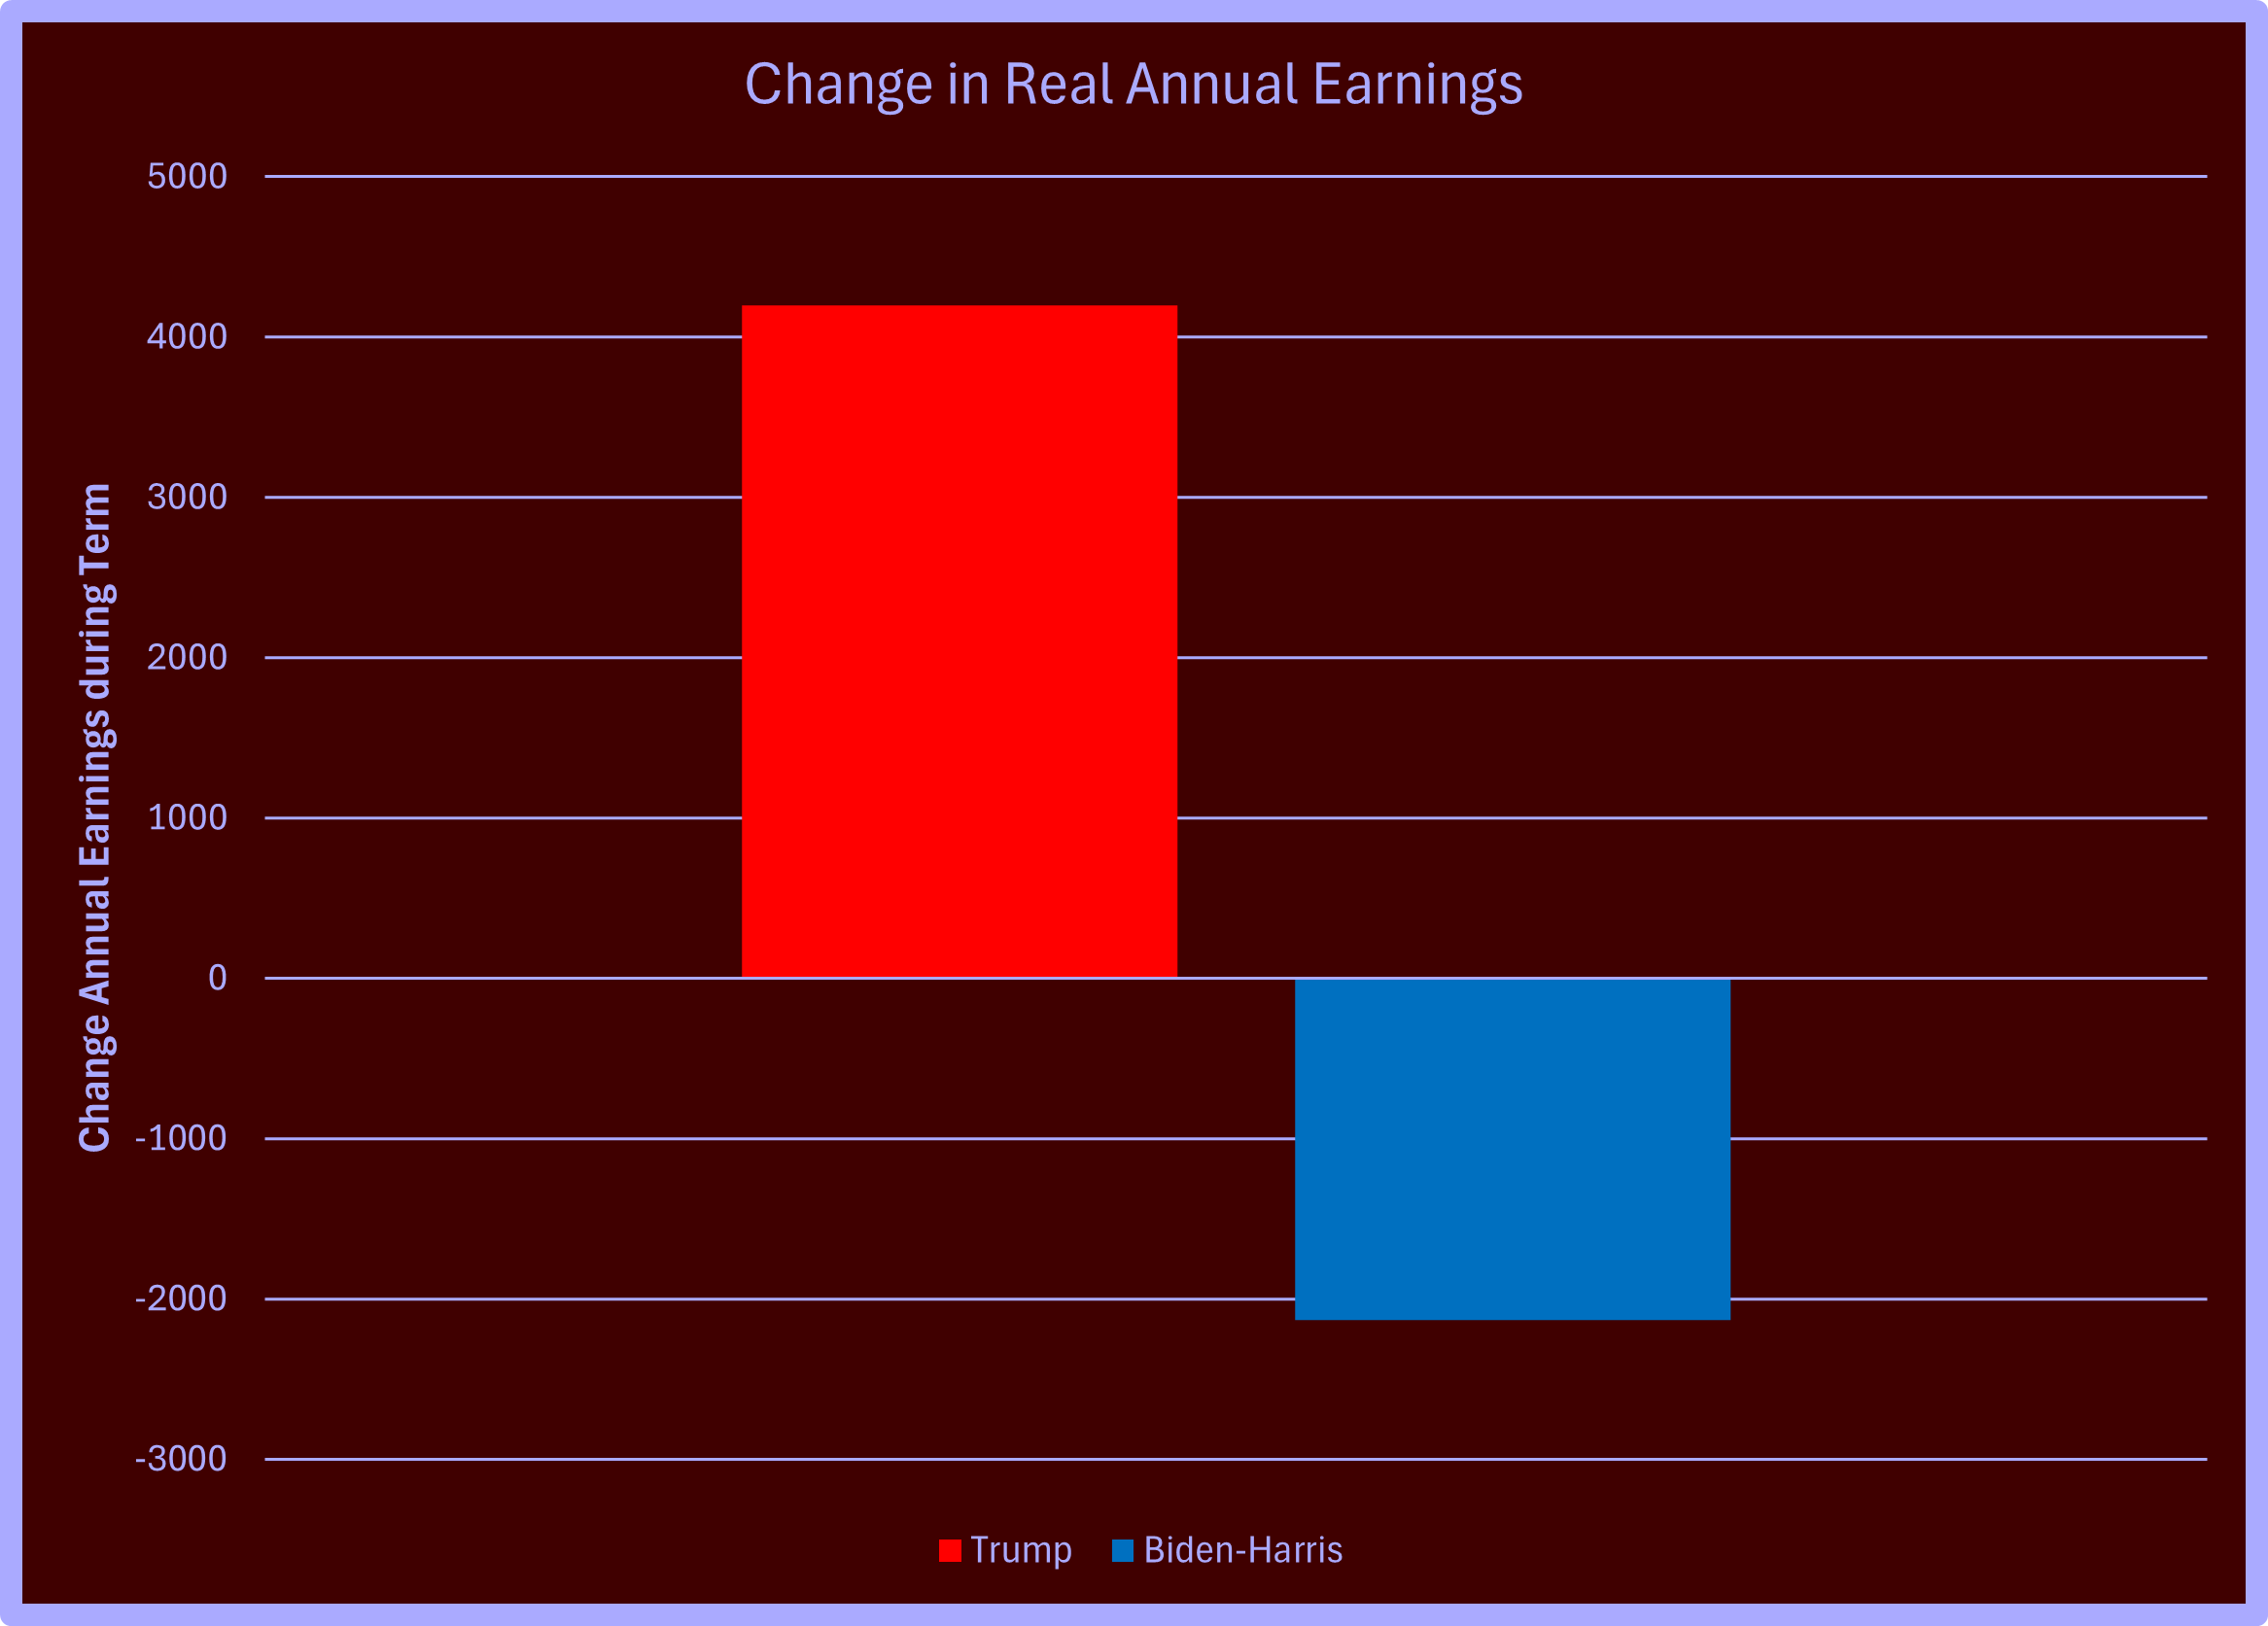
Similarly, the change in individual real annual earnings increased by $4200 during the Trump term and decreased by $2132 during the Biden-Harris term.
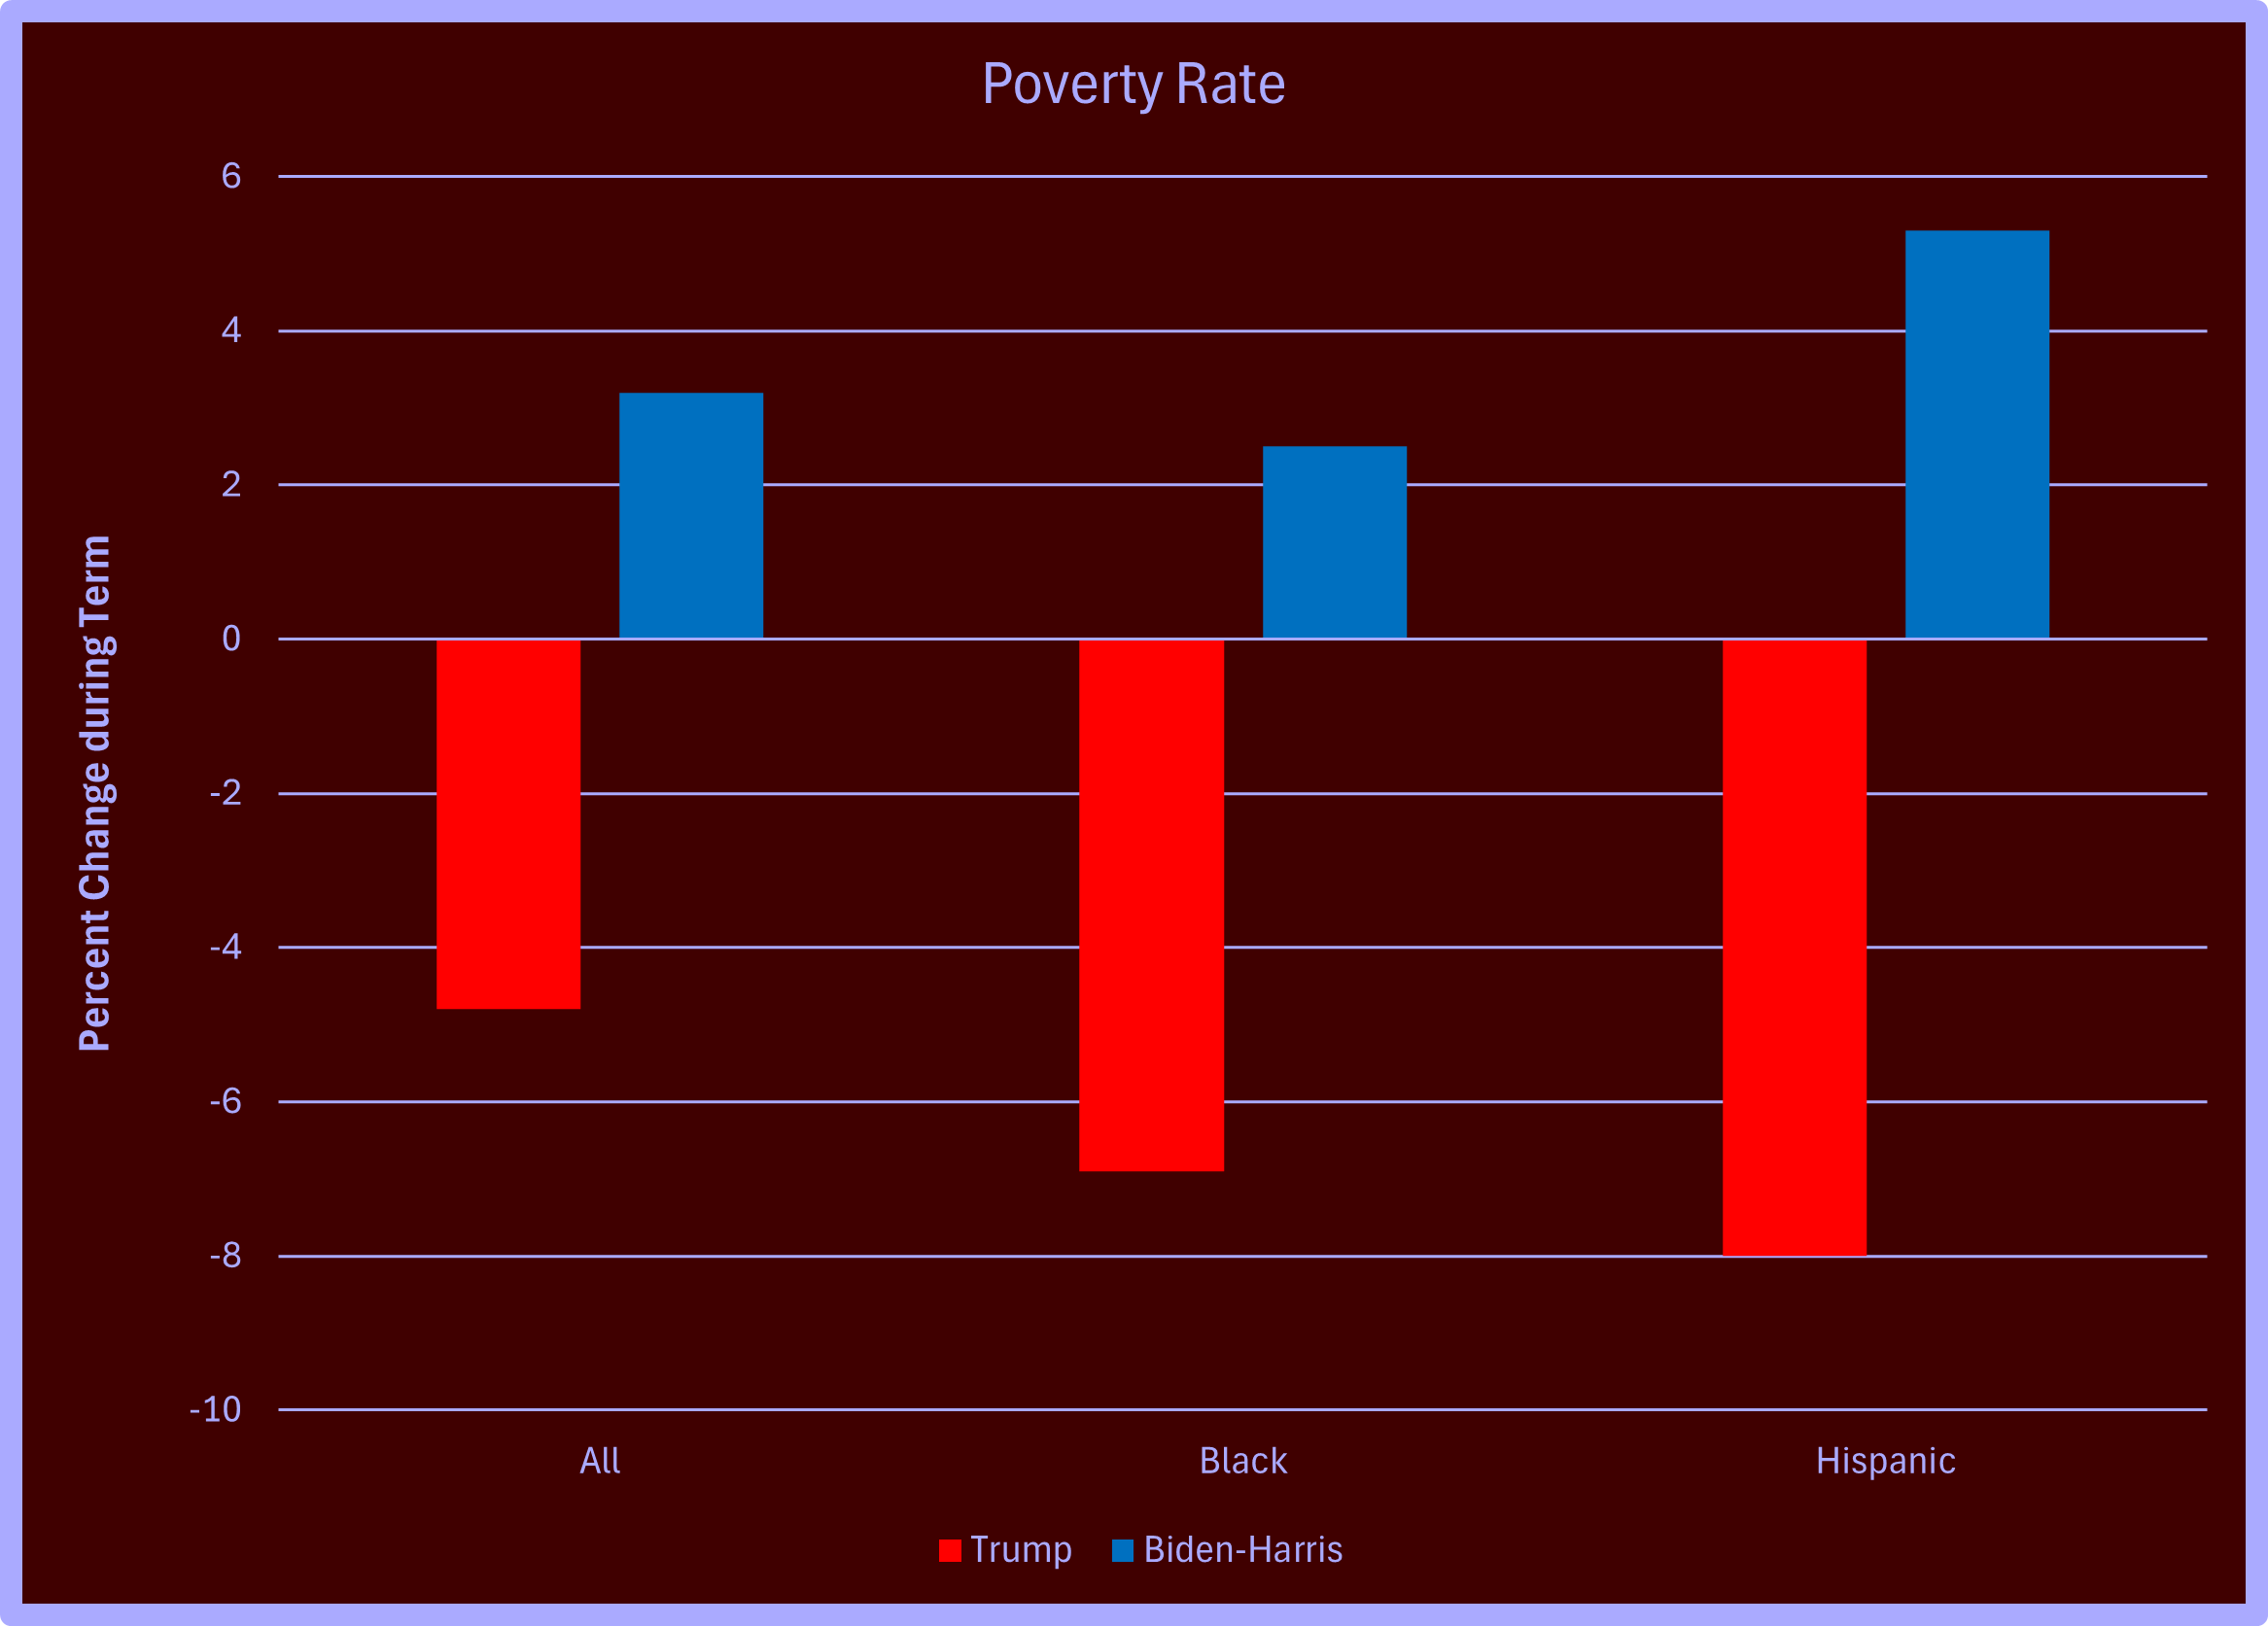
Let's move on to the poverty rate. During the Trump term, the overall poverty rate was down 4.8%, a significant improvement that directly affected the lives of many Americans. However, this positive trend reversed in the Biden-Harris term, with the overall rate increasing by 3.2%, impacting blacks a bit less up by 2.5% and Hispanics substantially more by 5.3%. These changes in poverty rates reflect the real-life impact of economic policies on the average American.
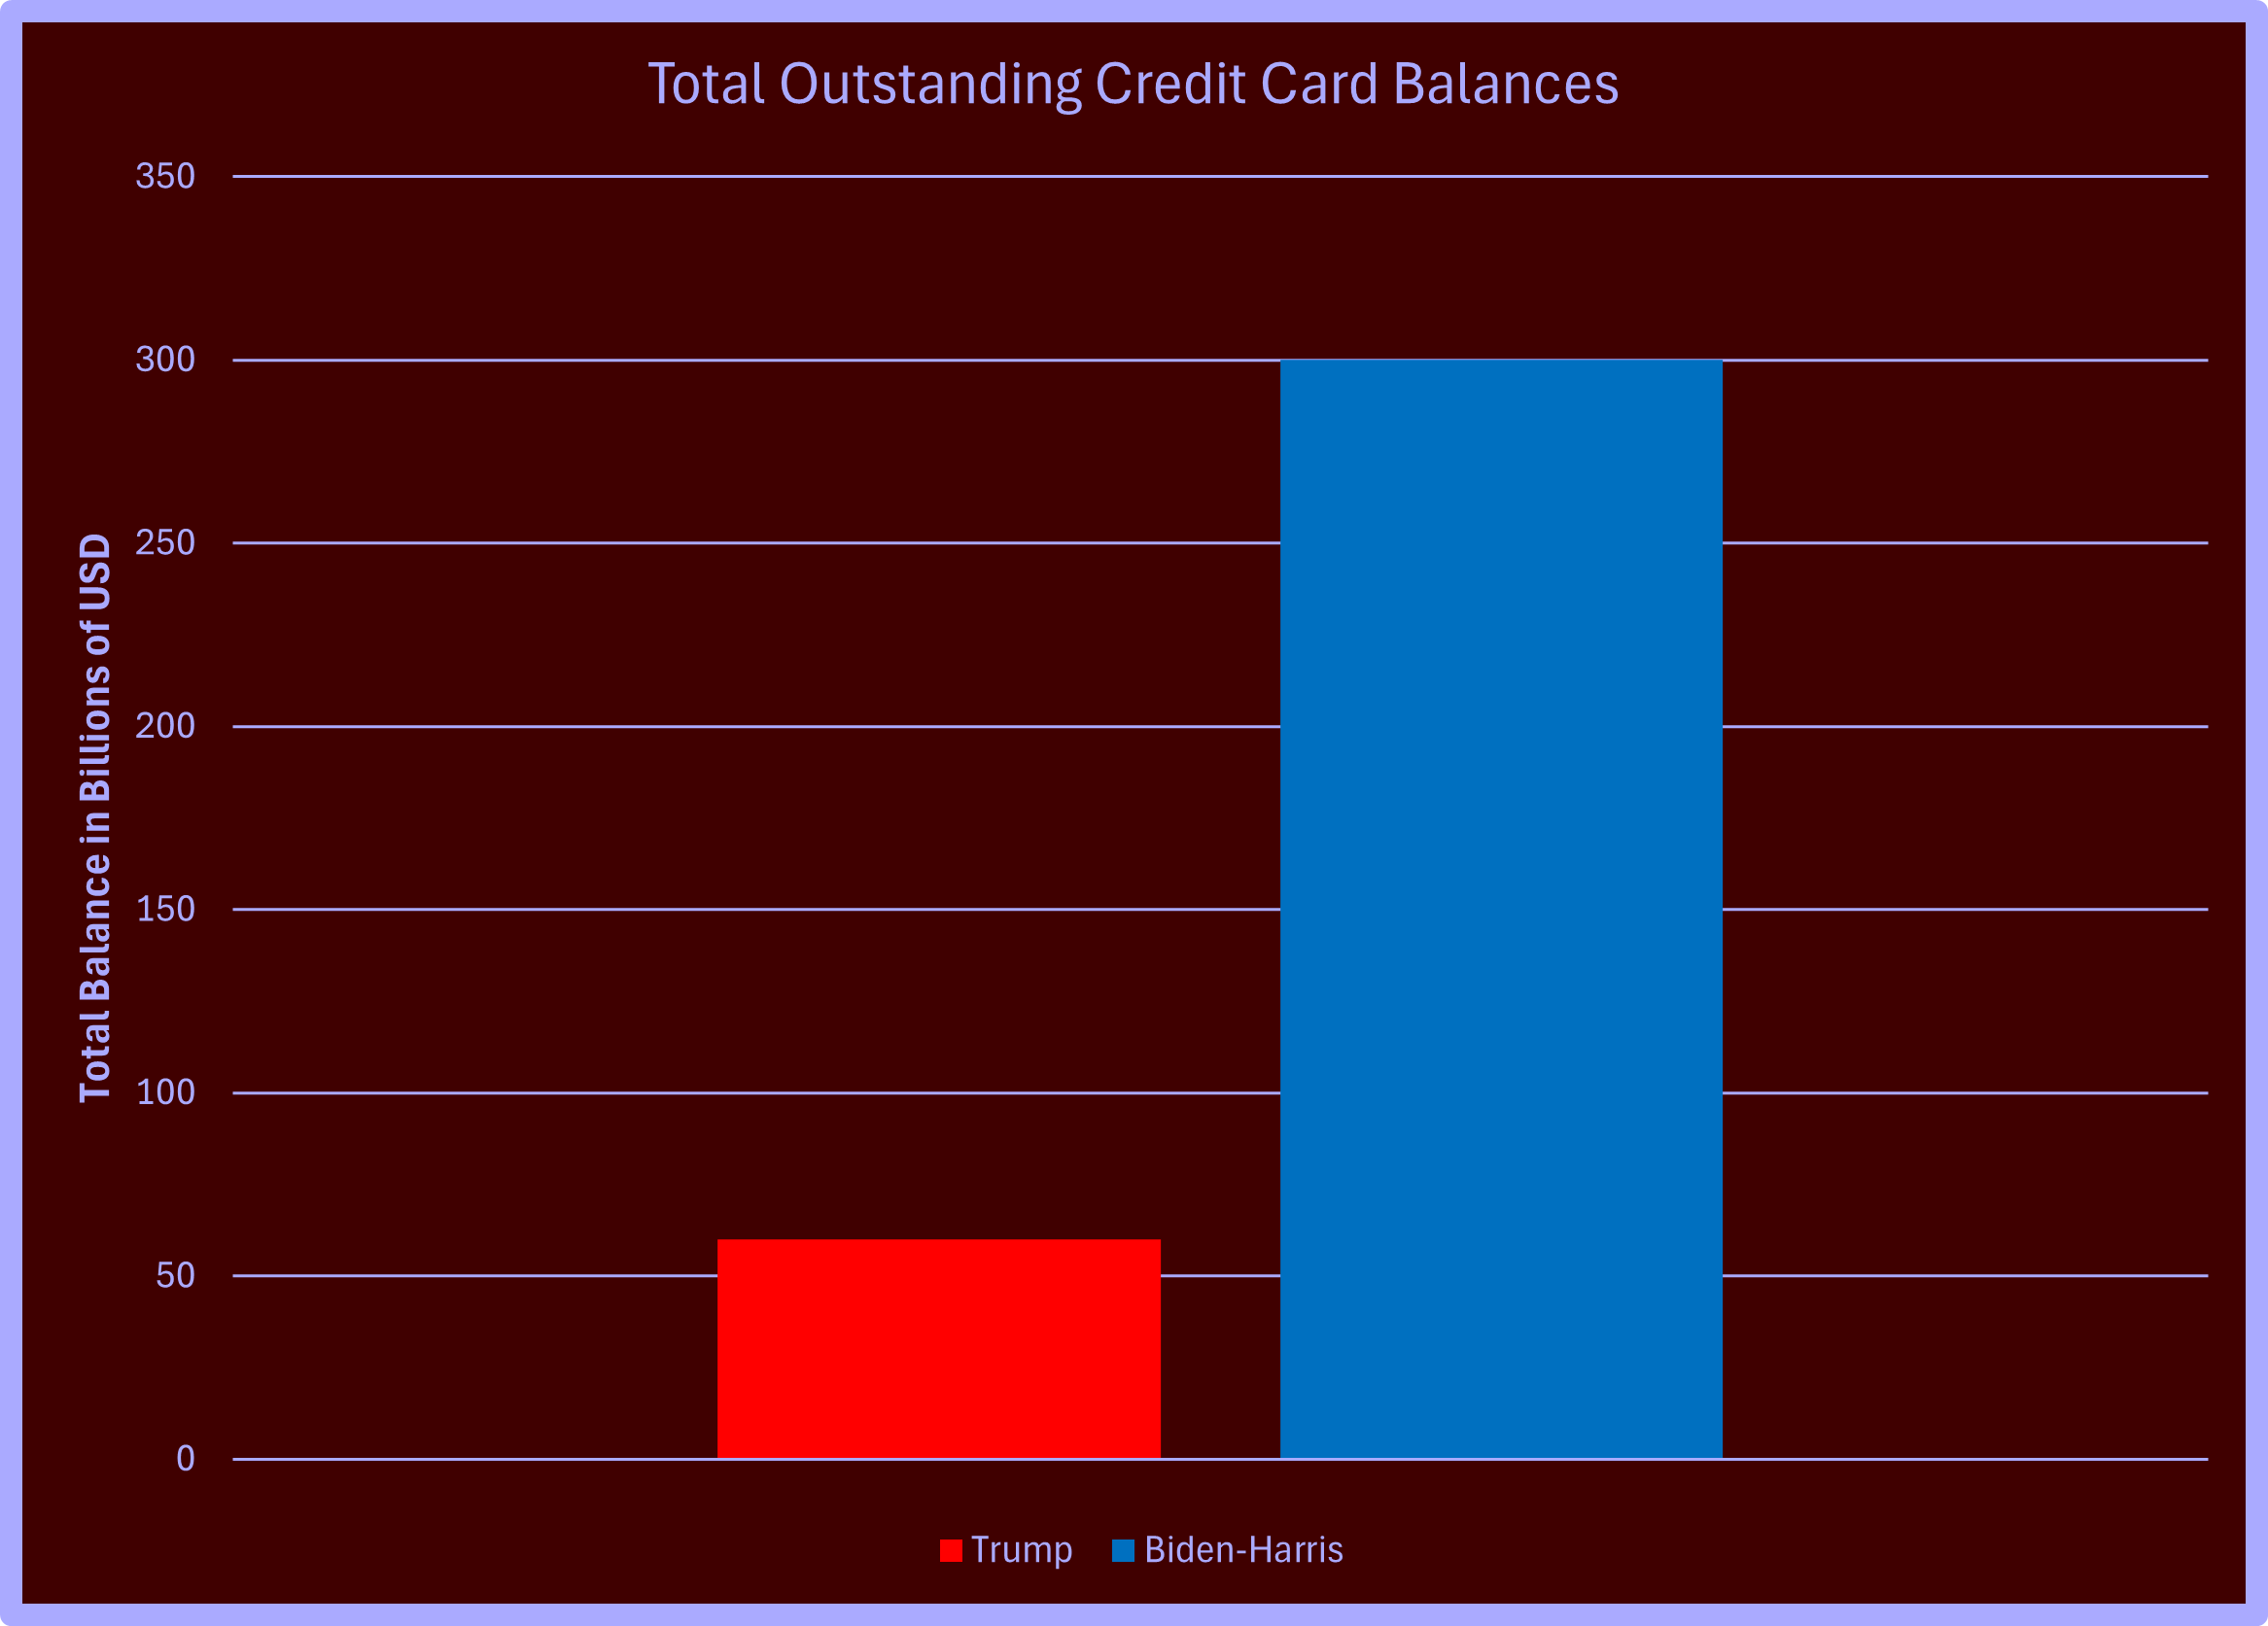
Credit card balances are a good proxy for how well folks do financially. When they are doing well, their credit card balances are low, but they must borrow more and run higher balances when times are tough. Total credit card balances were about six times higher in the Biden-Harris years than in the Trump years.
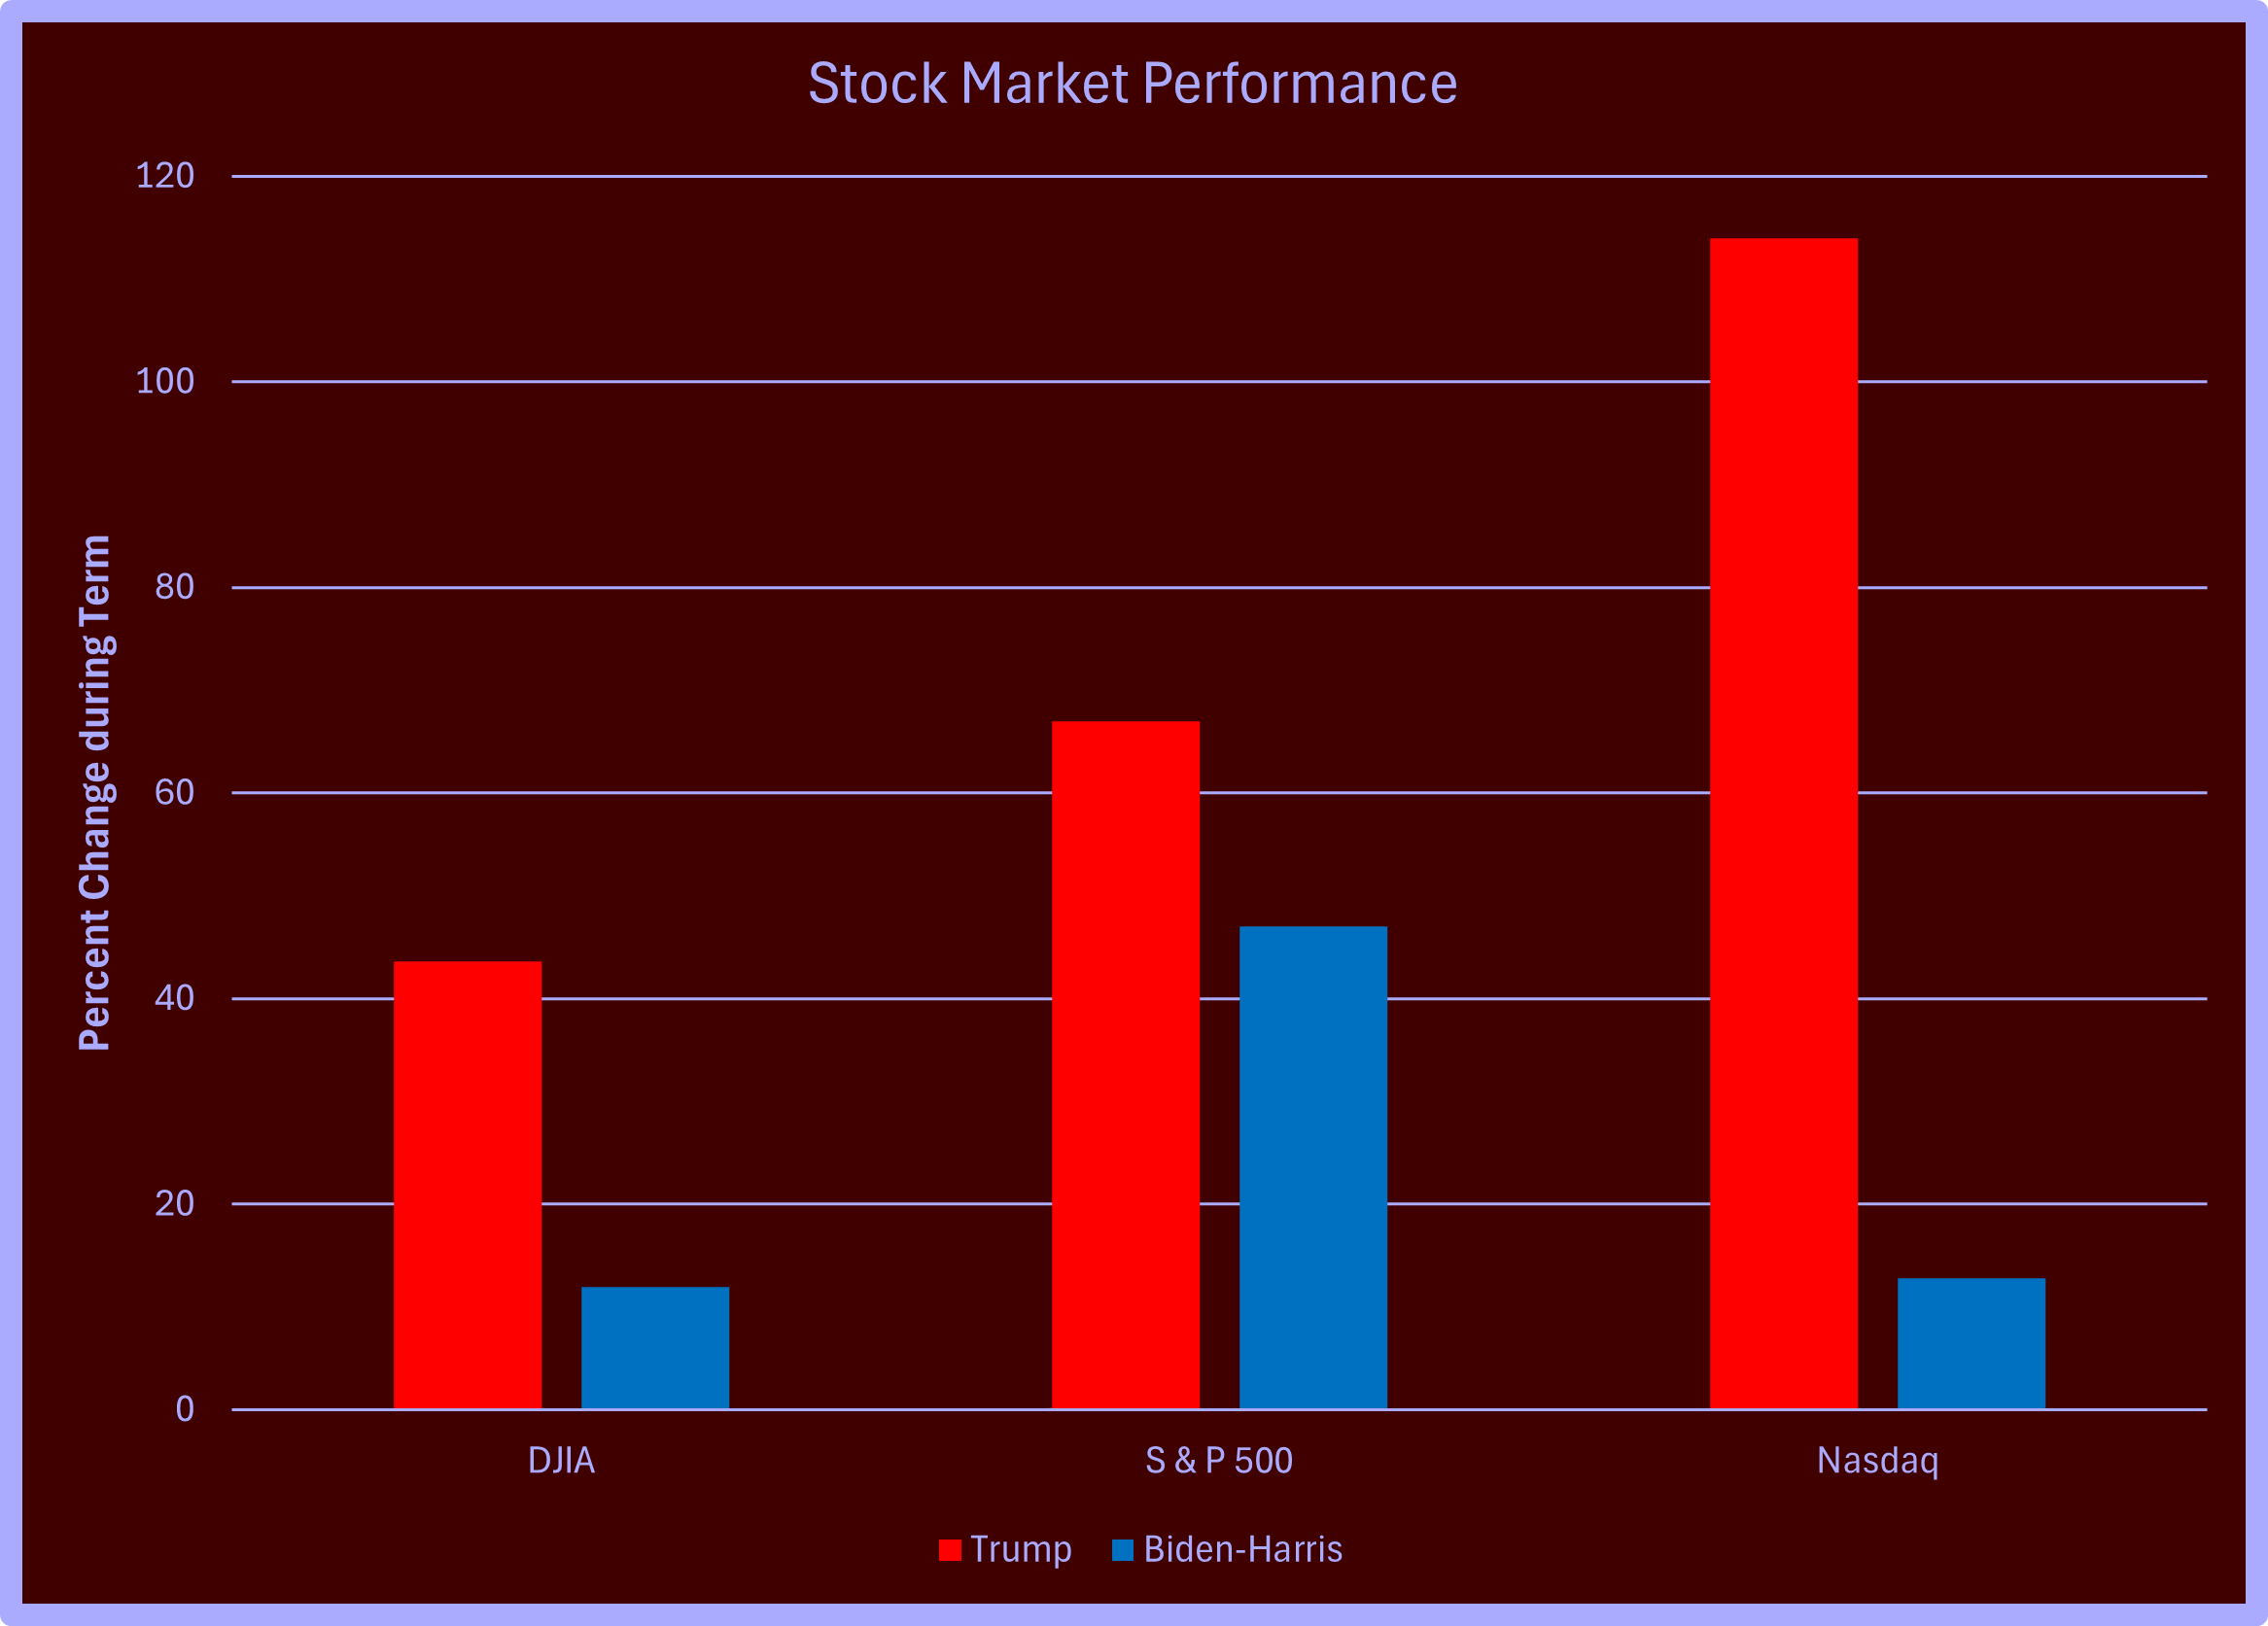
Another measure of income is in investments and retirement accounts. When Trump was President, the Dow was up 43.6%, the S&P was up 67%, and the Nasdaq was up 114%. When Biden and Harris took over, the Dow was about a fourth as much as under Trump up omly 11.9%, the S&P was up 47%, and the Nasdaq was up a bit over one-tenth of the gain under Trump at 12.8%.
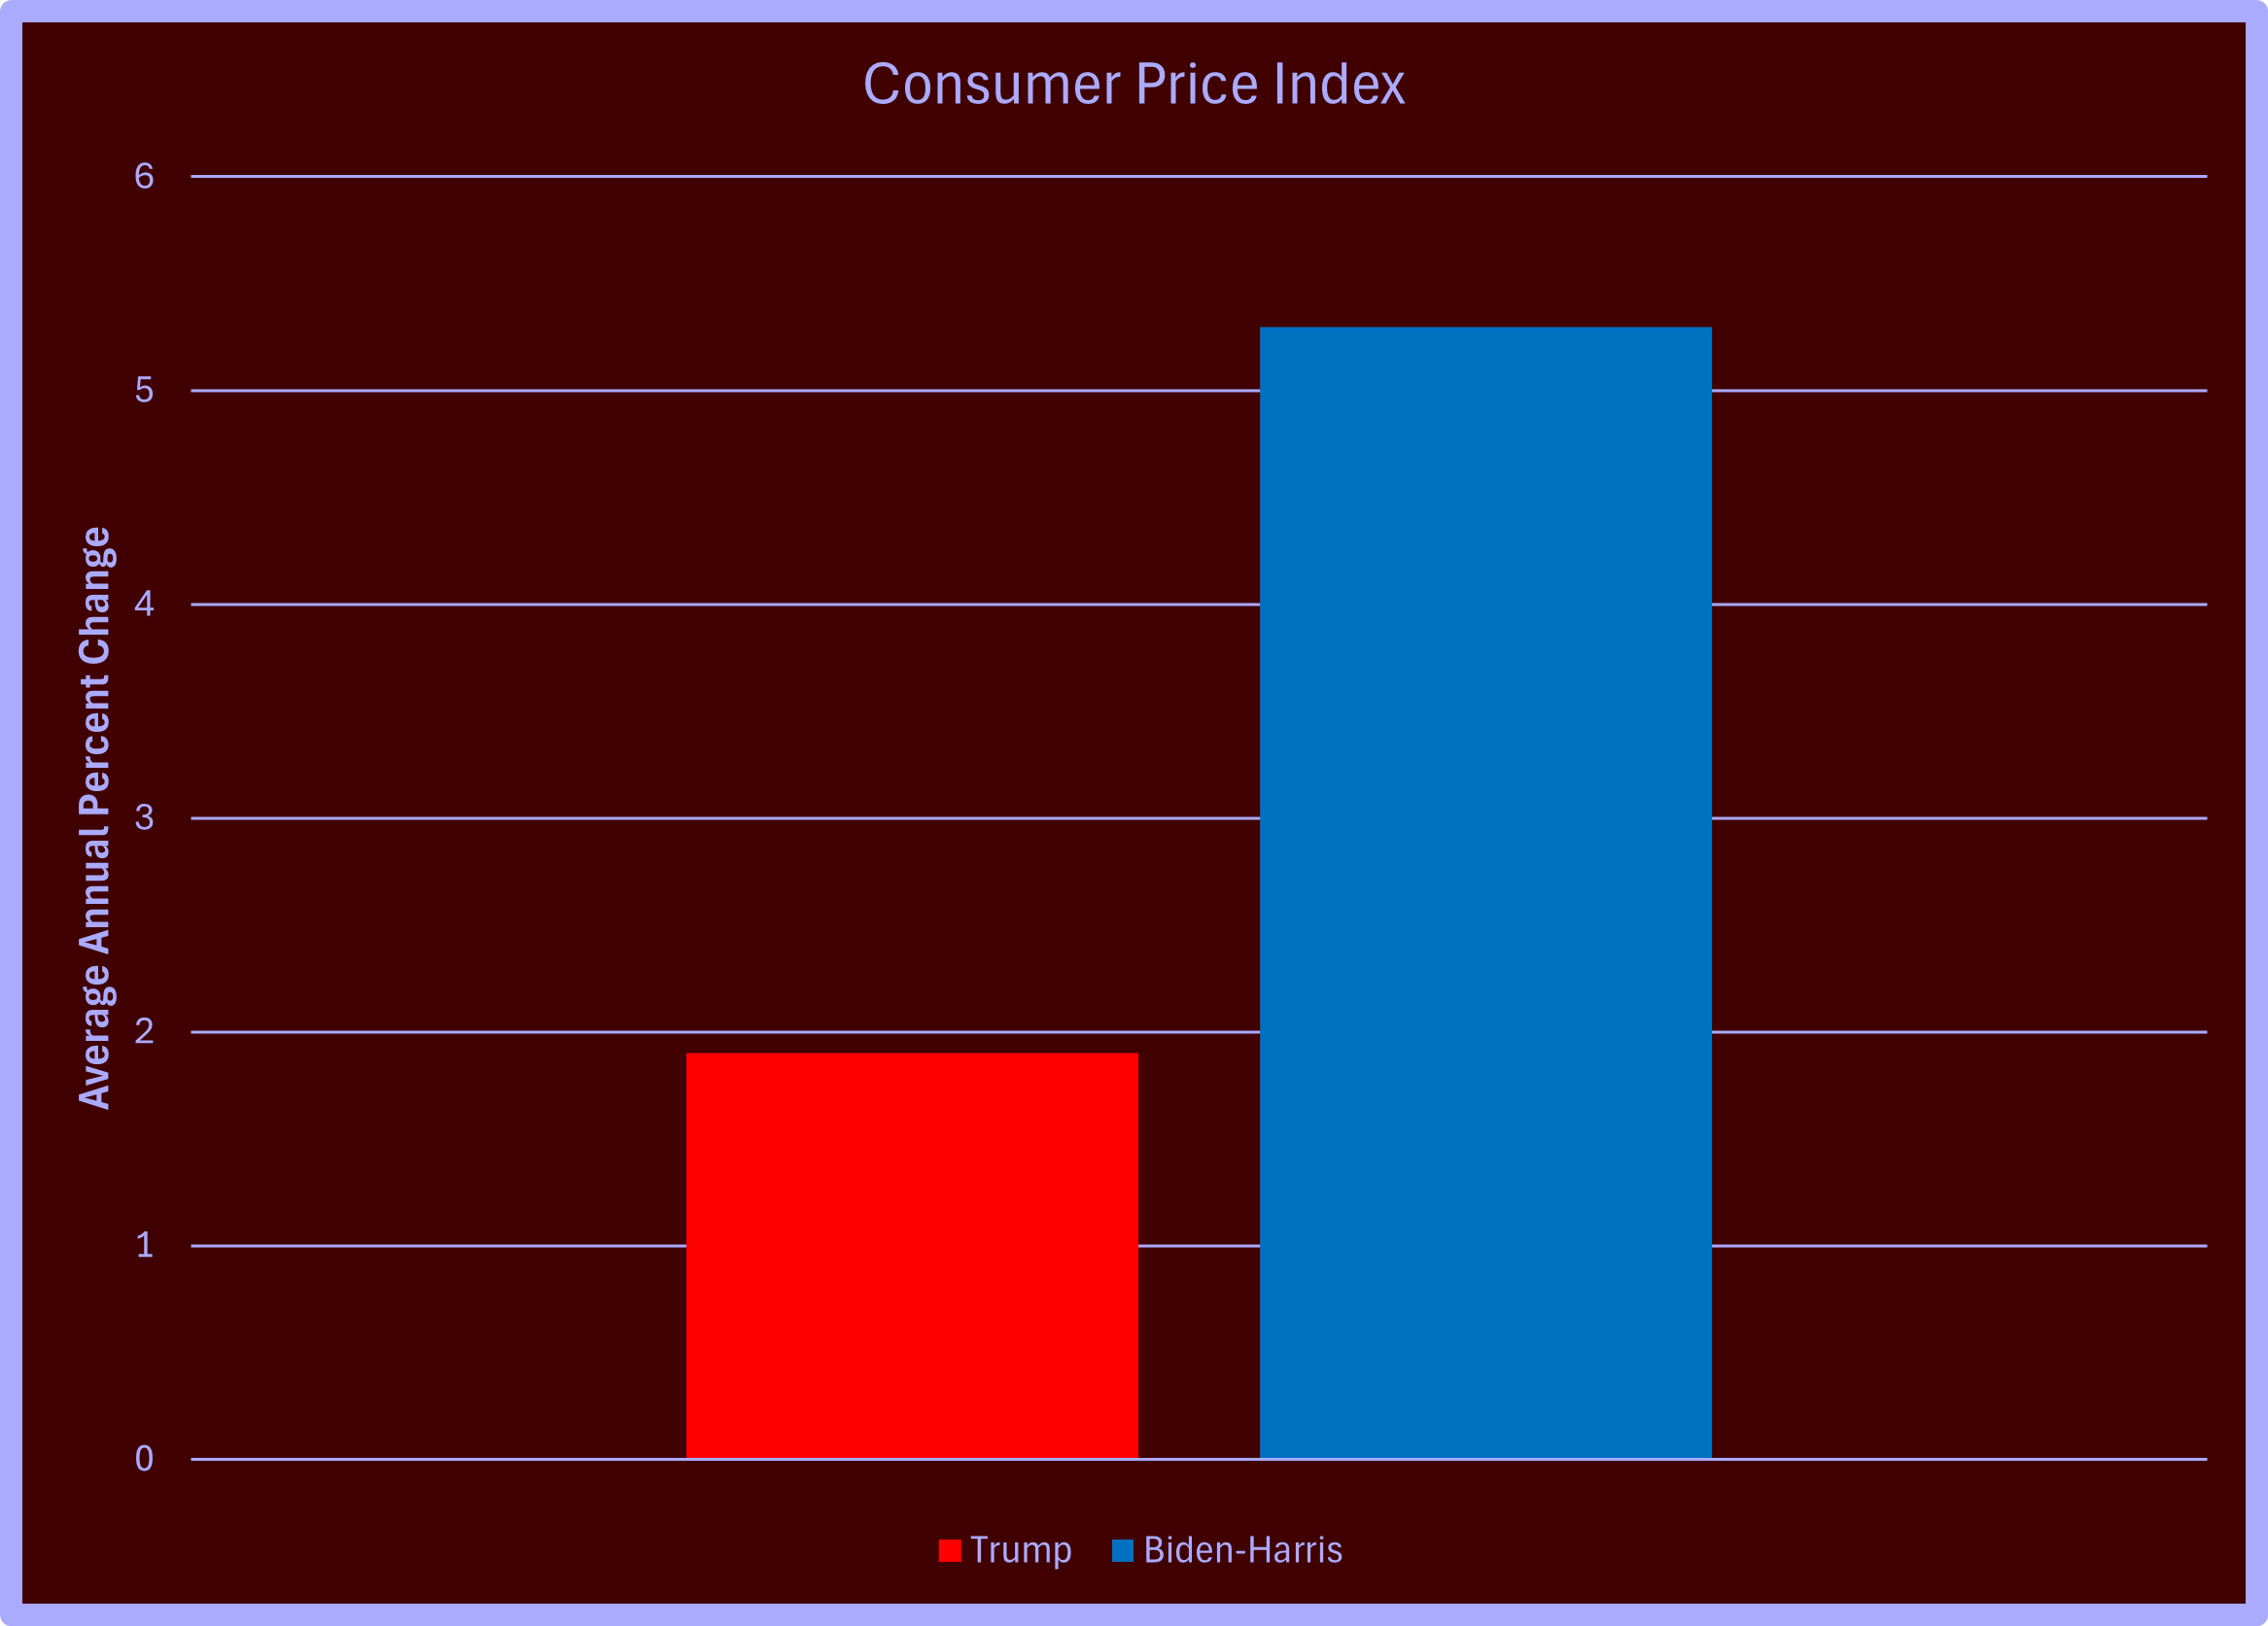
While income in all the above categories was lower under Biden-Harris than in Trump, expenses were higher. The Consumer Price Index (CPI), a measure of the average change over time in the prices paid by urban consumers for a market basket of consumer goods and services, increased an average of 1.9% per year, while under Biden-Harris, it nearly tripled to 5.3% annually.
If we look at some of the components of the CPI, we can see in the chart below that Trump bested Biden-Harris in every category. Trump's numbers are so close to 0 for new and used cars that they are invisible on the graph.
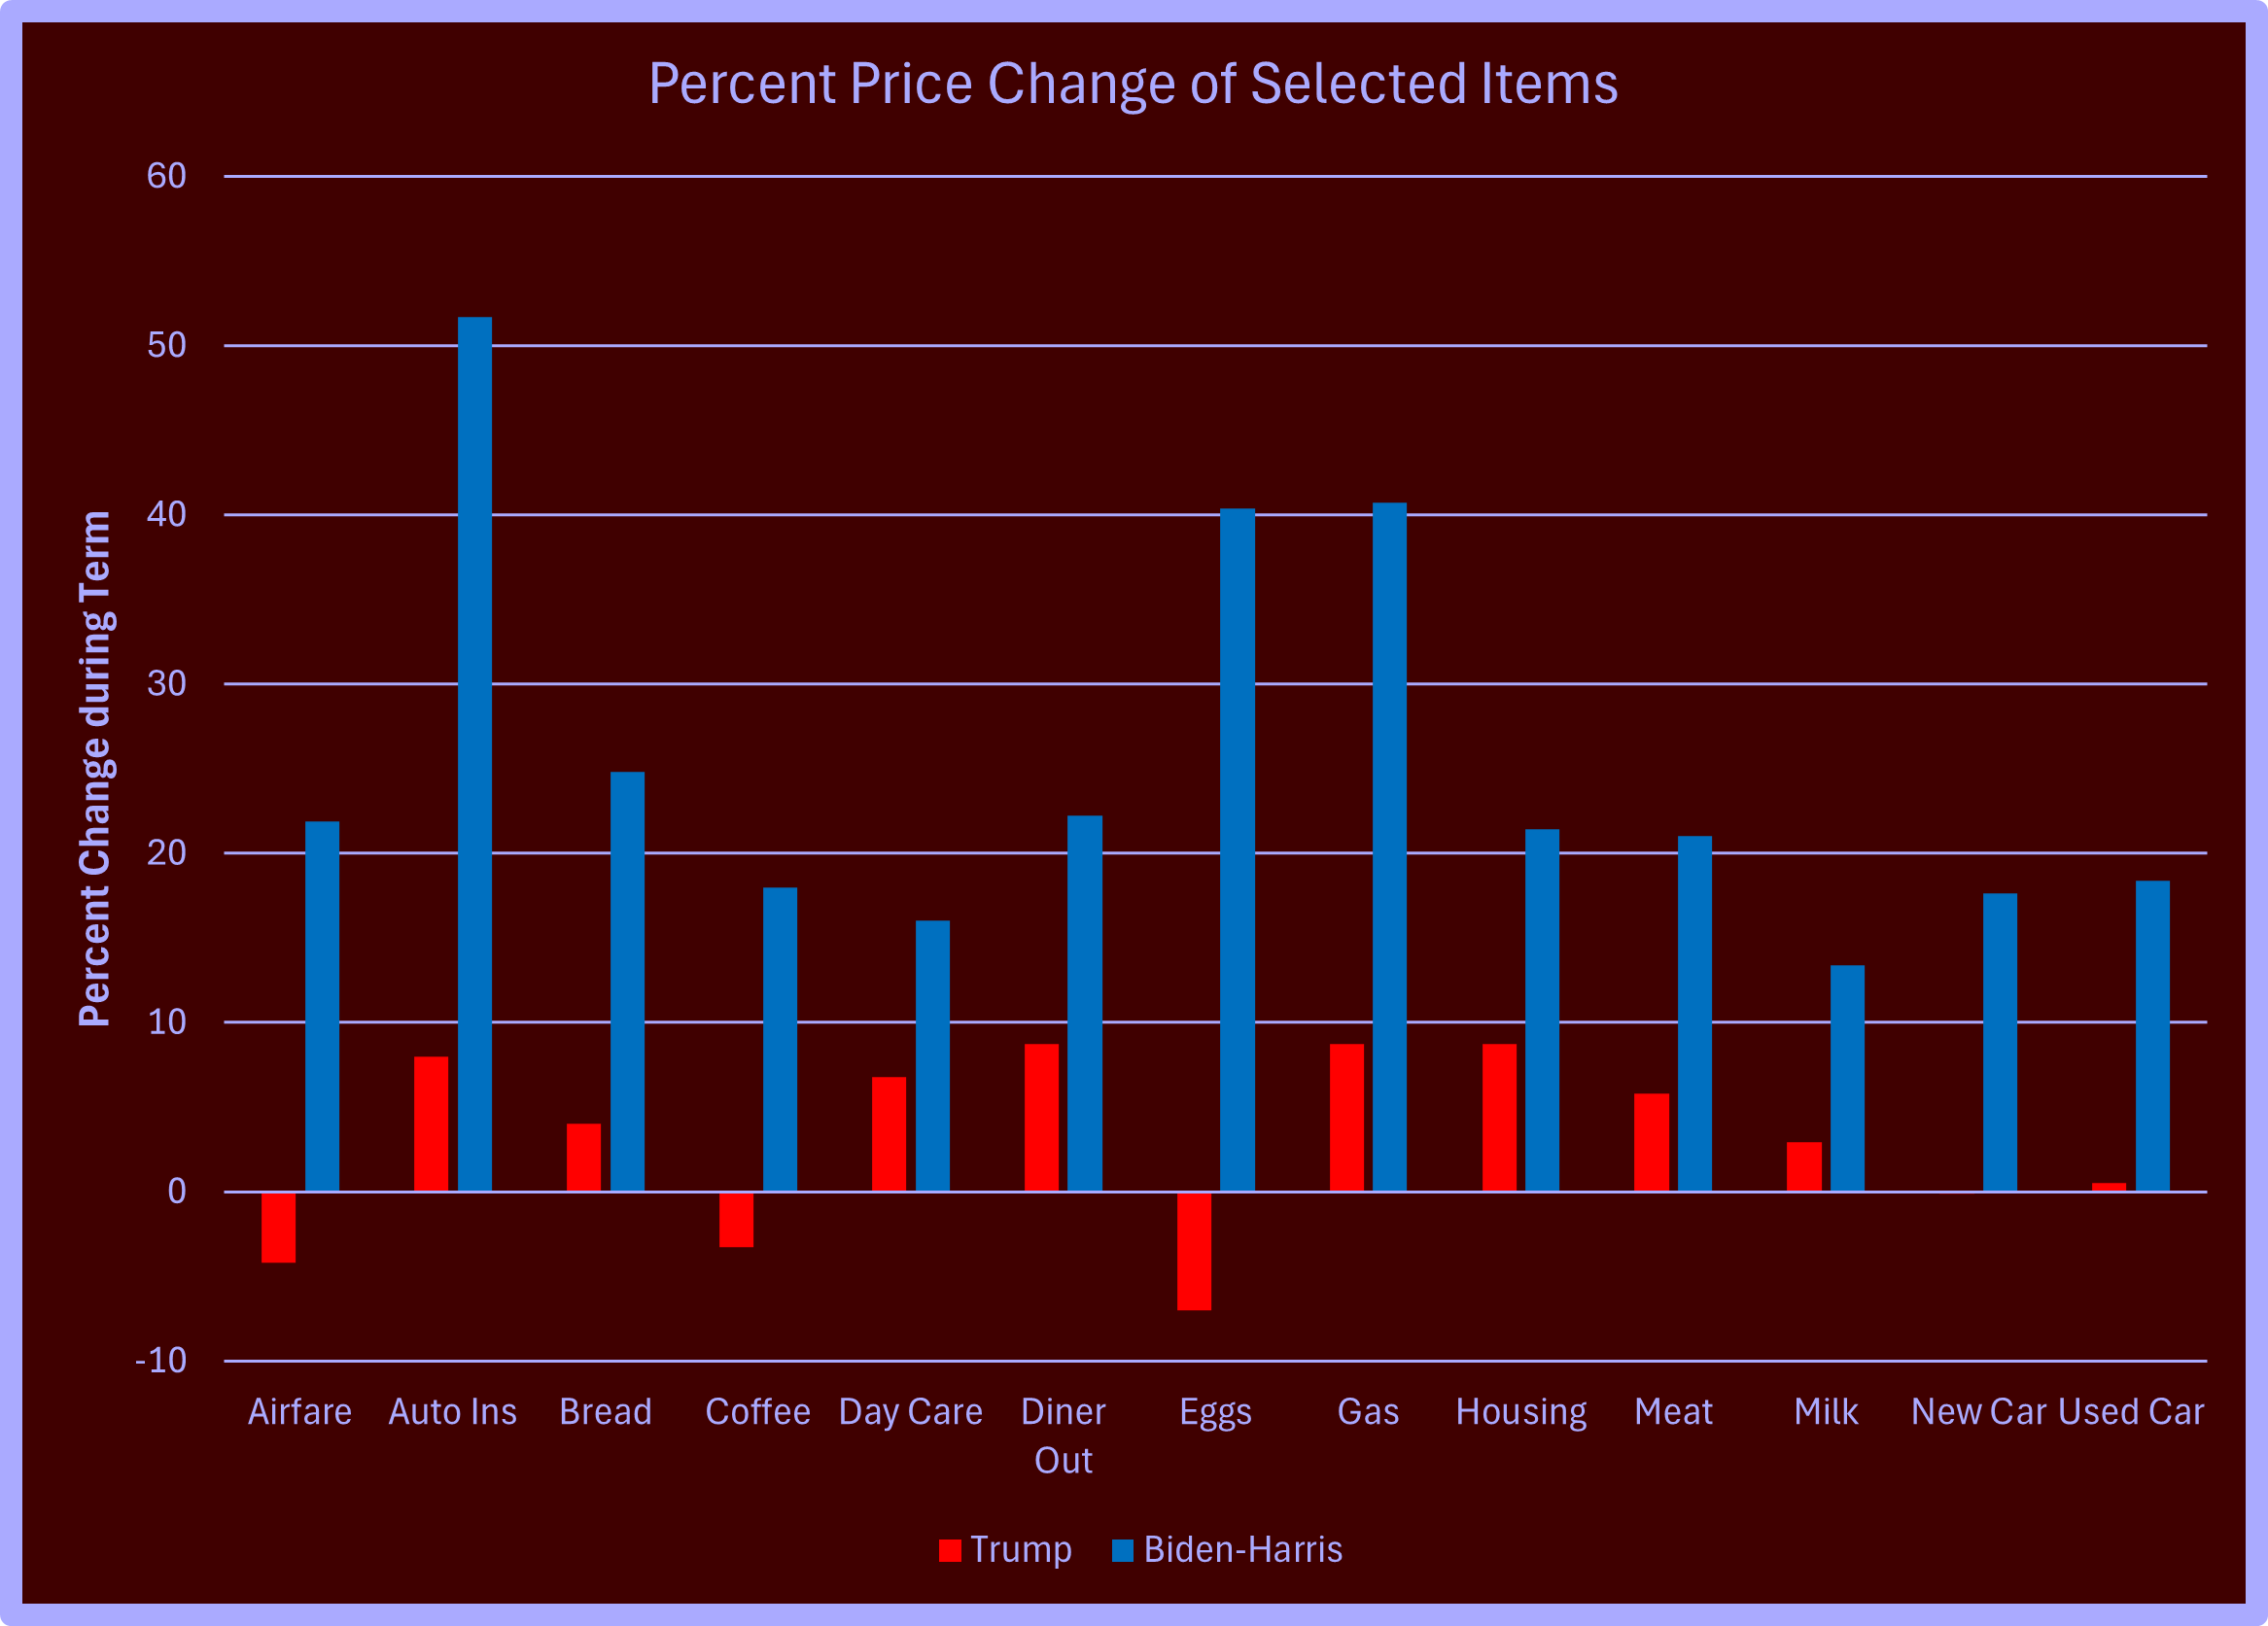
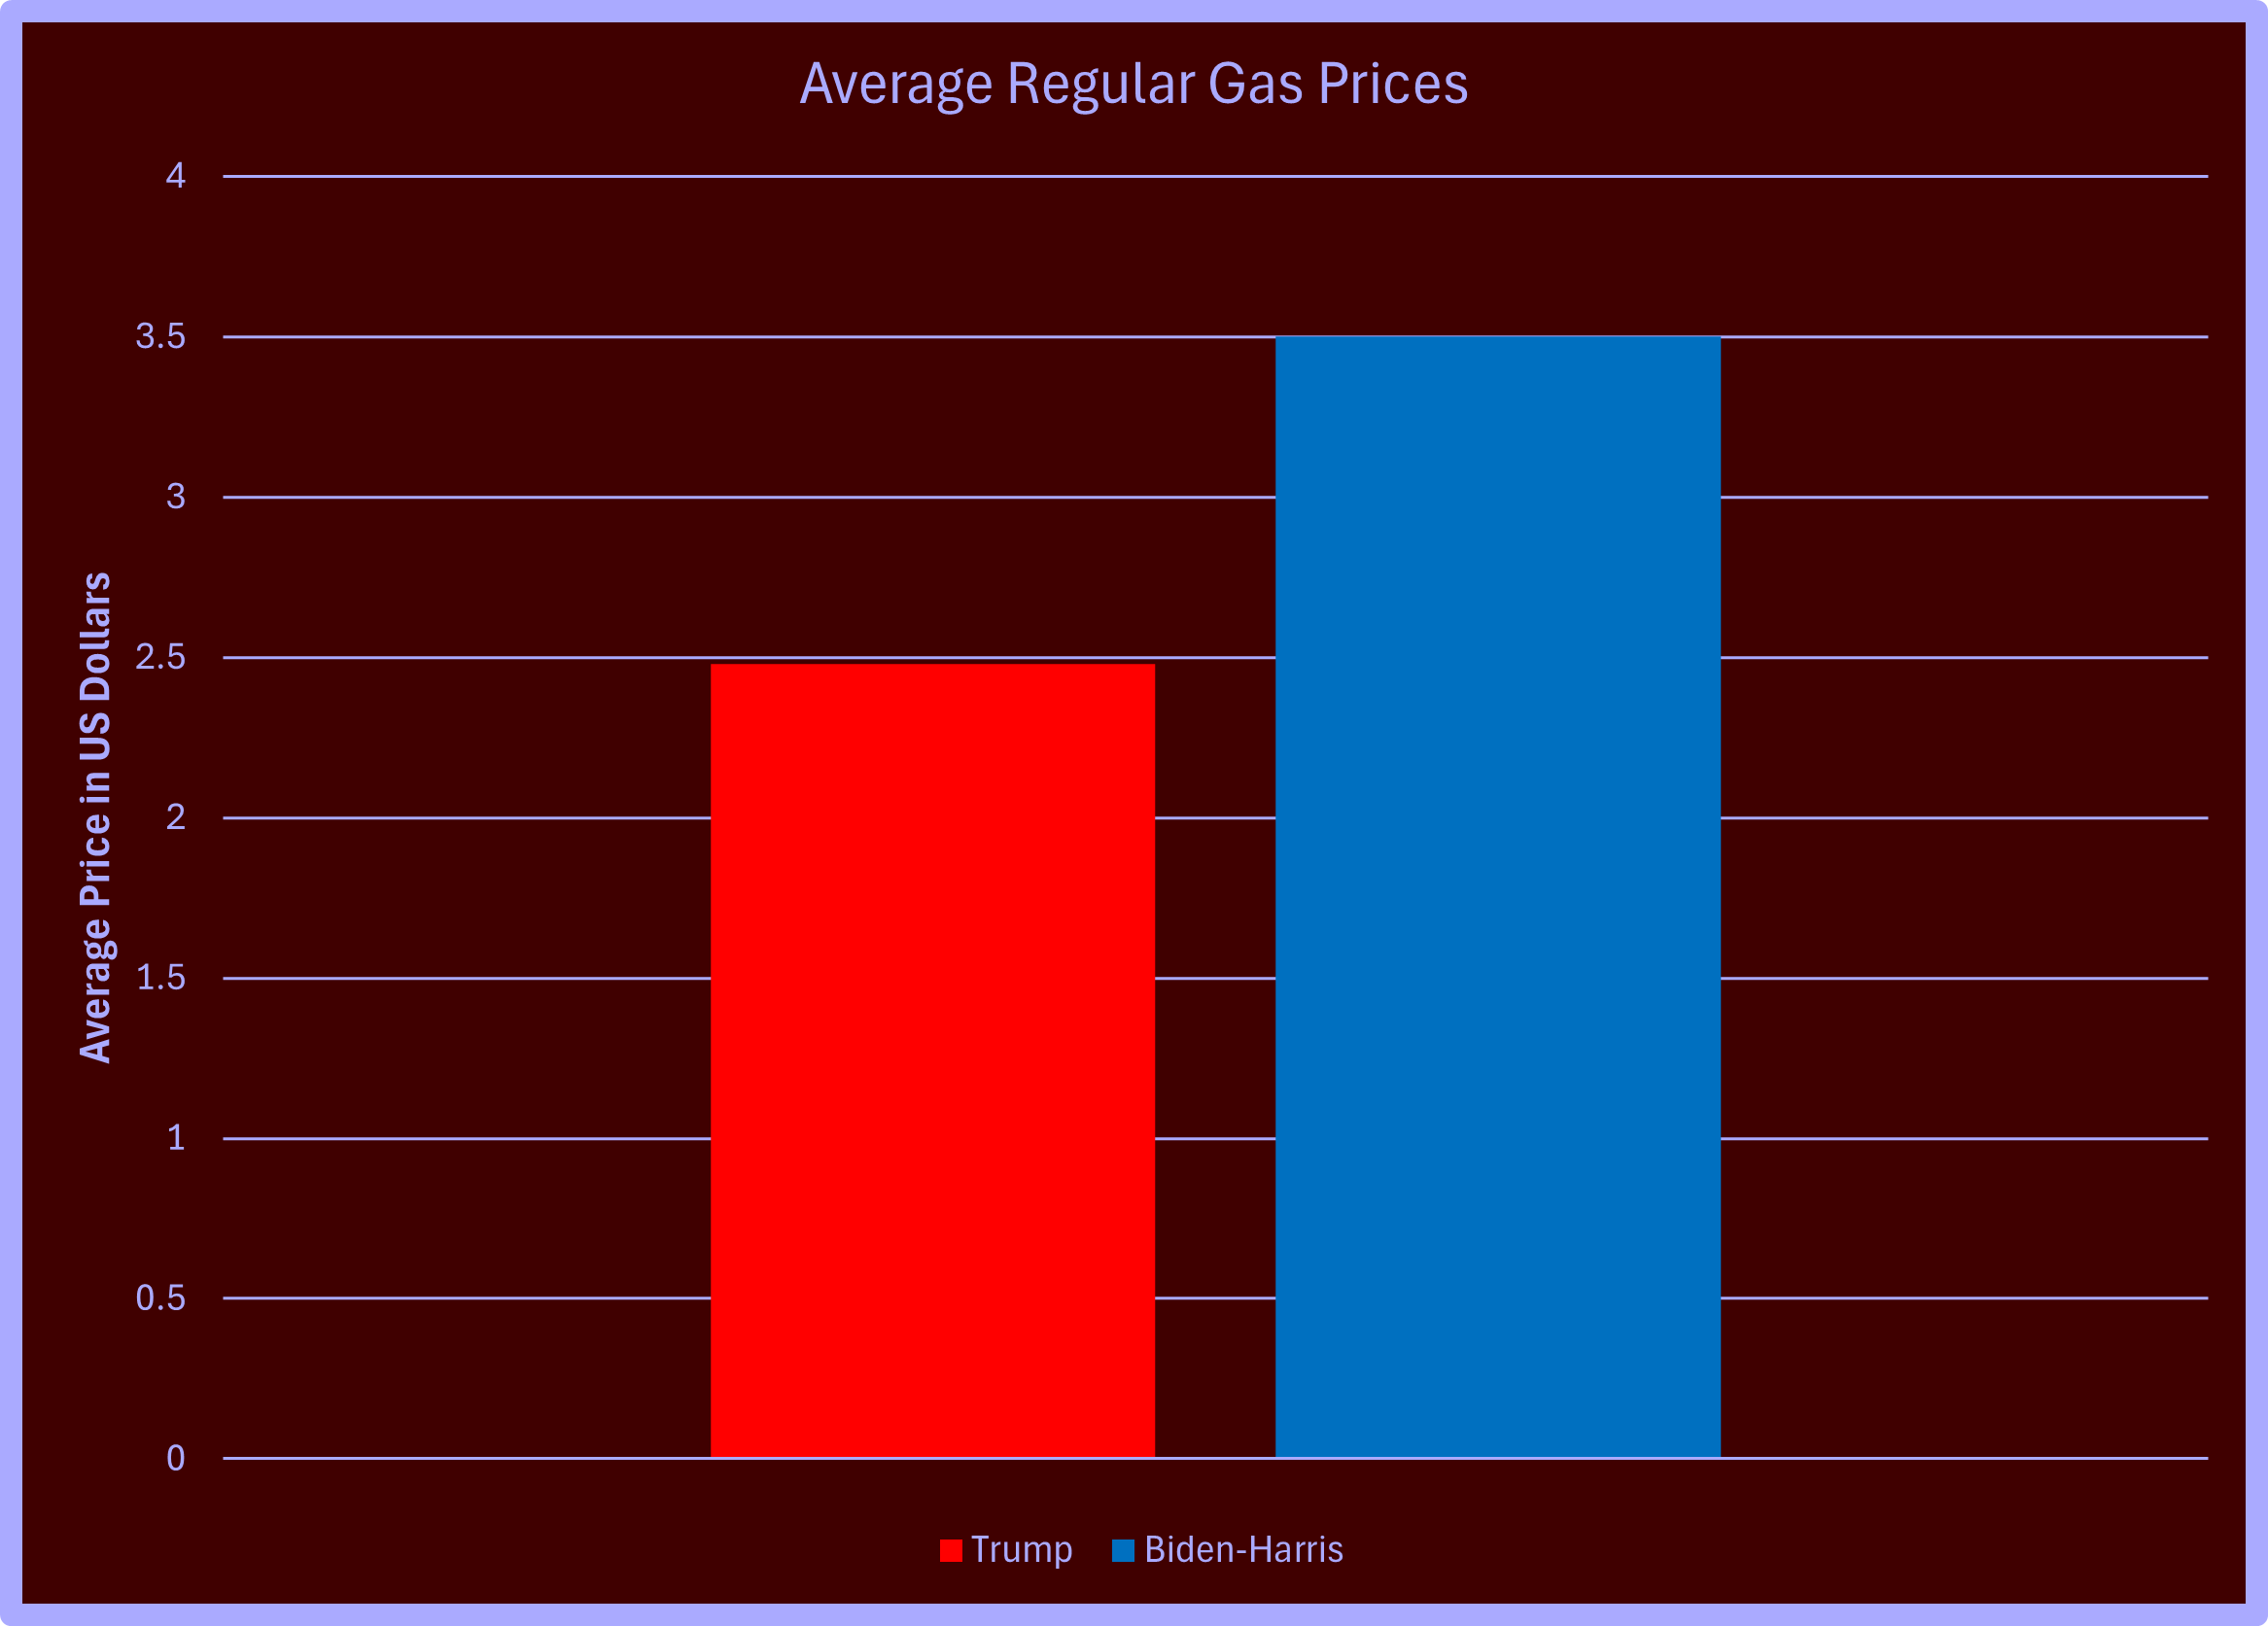
In absolute terms, average gas prices went up a bit more than a dollar a gallon after Biden-Harris took over from Trump. That's a 41% increase. This gas price increase directly affects consumers at the pump. It drives up the price of almost everything else because it takes fuel to farm, manufacture, ship, and warehouse virtually every other product.
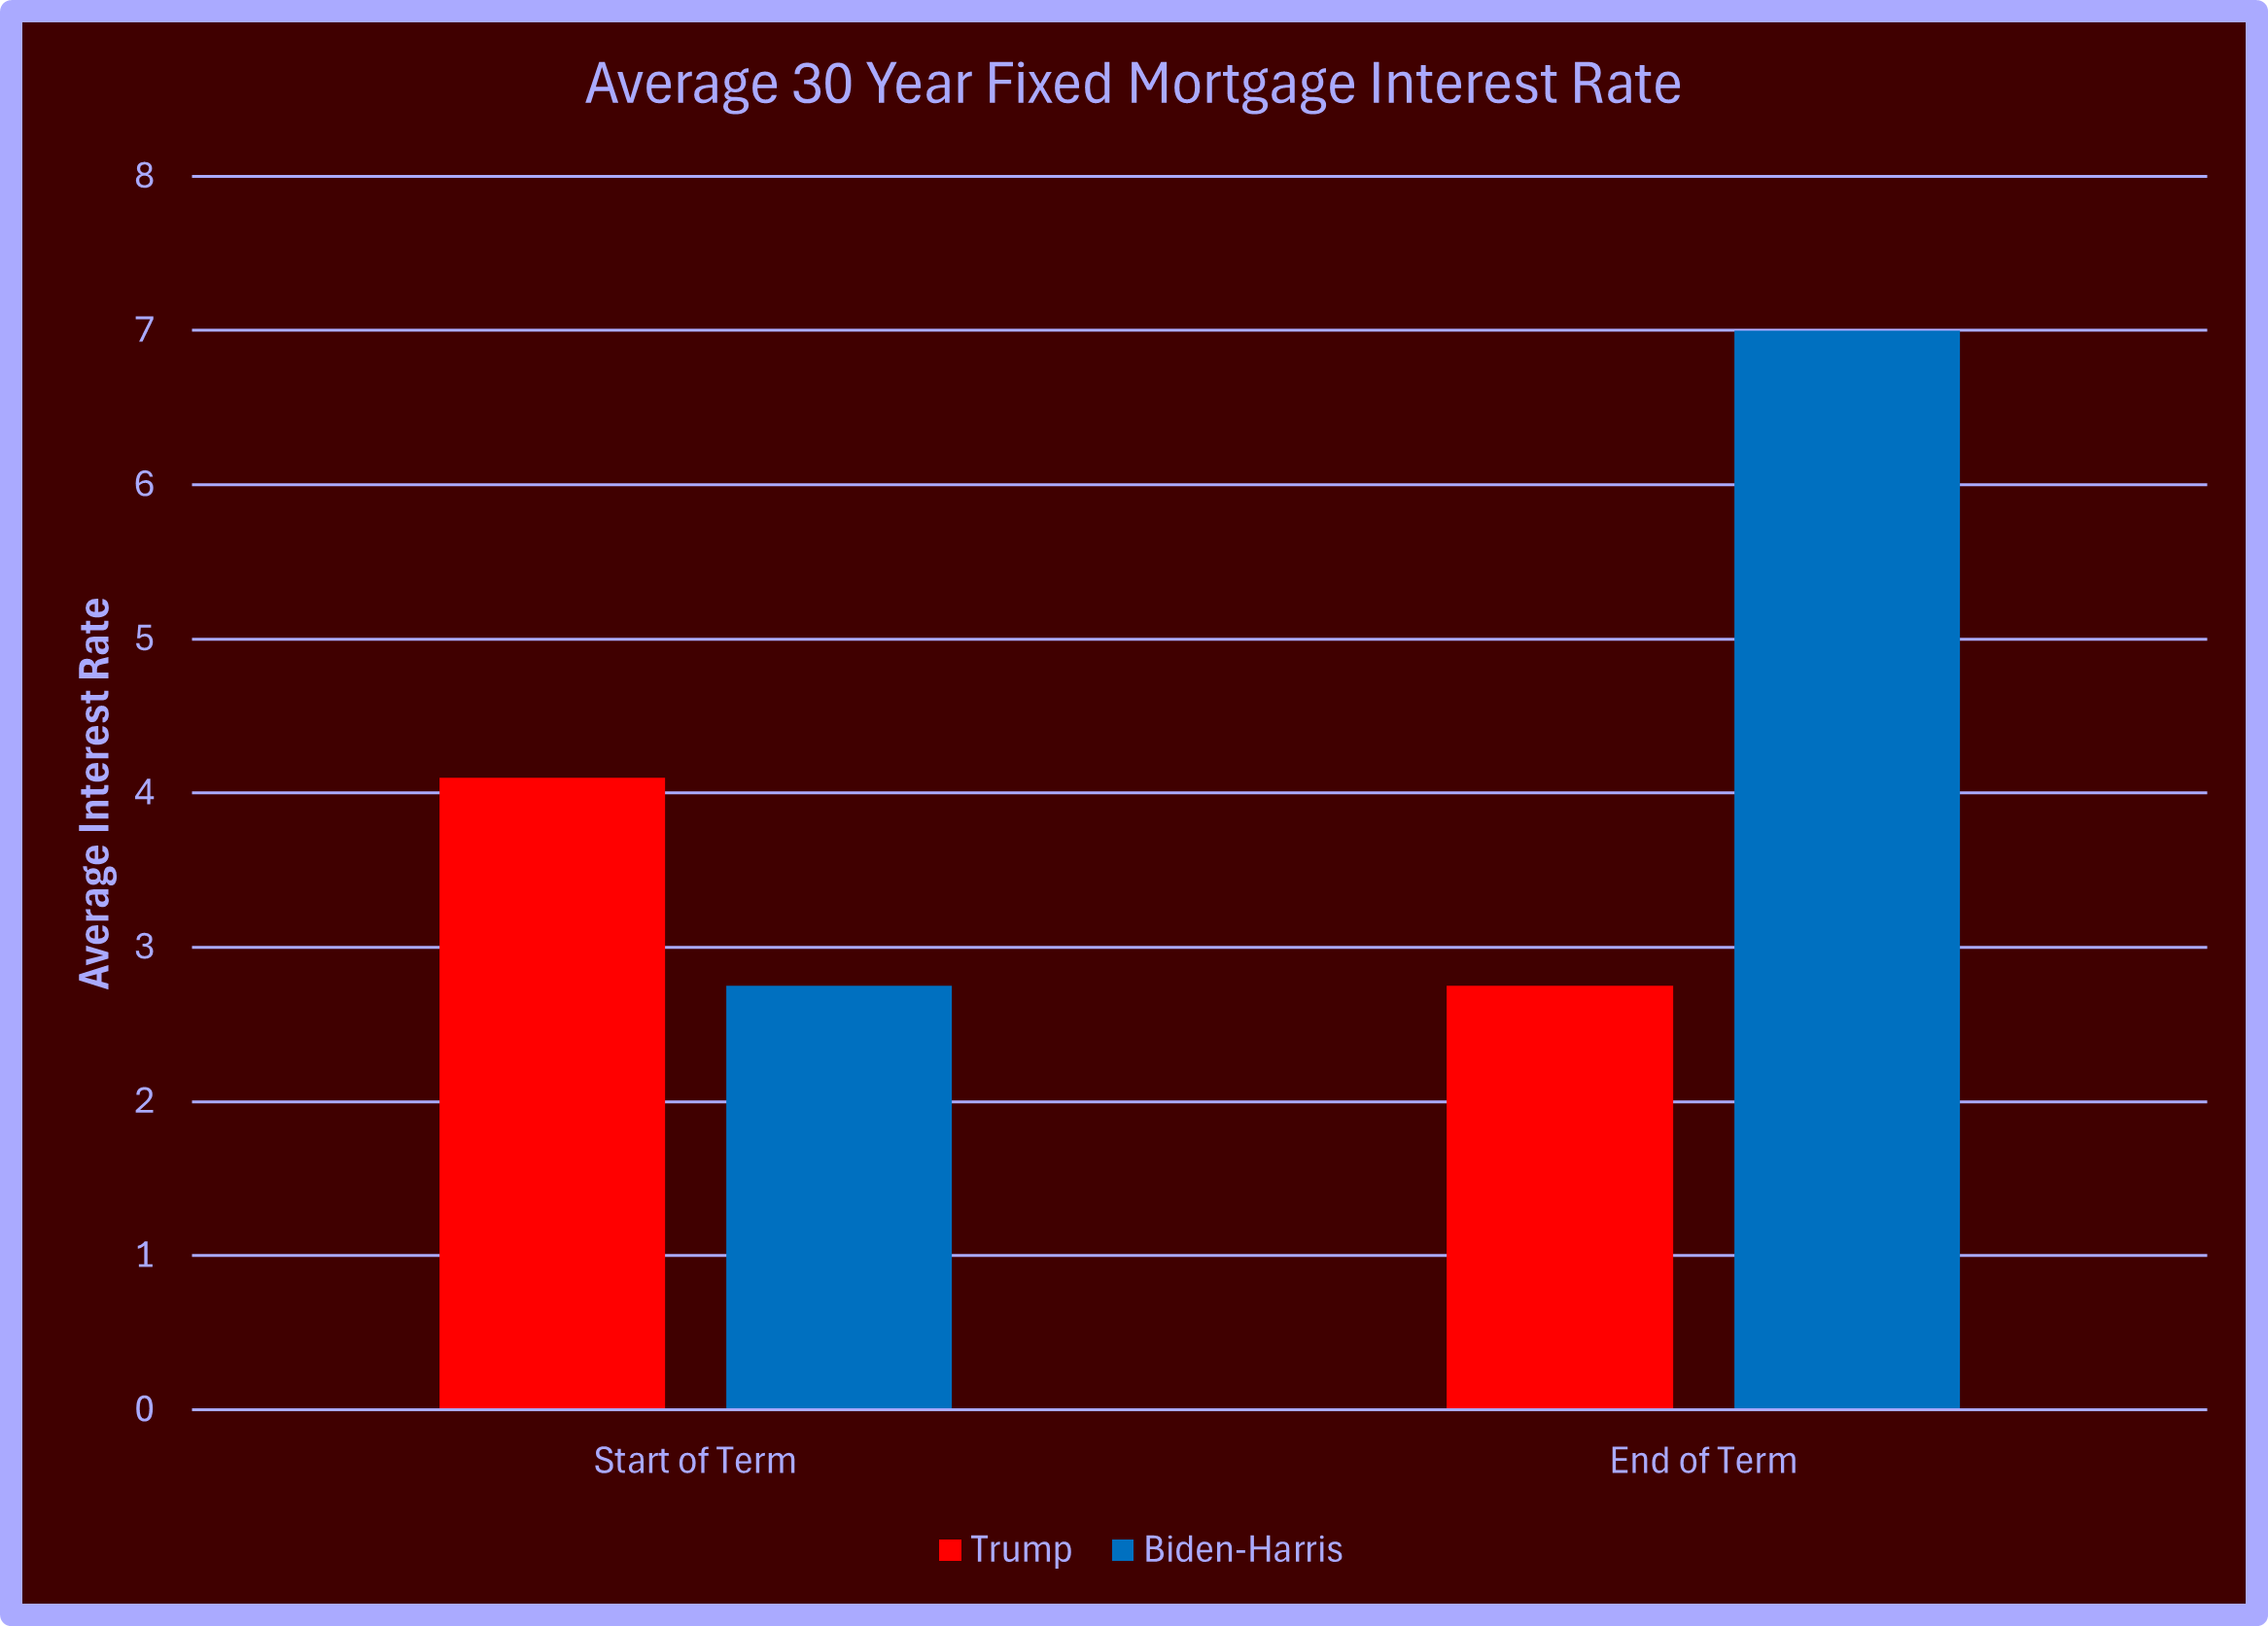
Mortgage rates also went up. As you can see, Trump reduced mortgage rates from the start of his term to the finish, while Biden-Harris increased those rates more than two and a half times during their term.
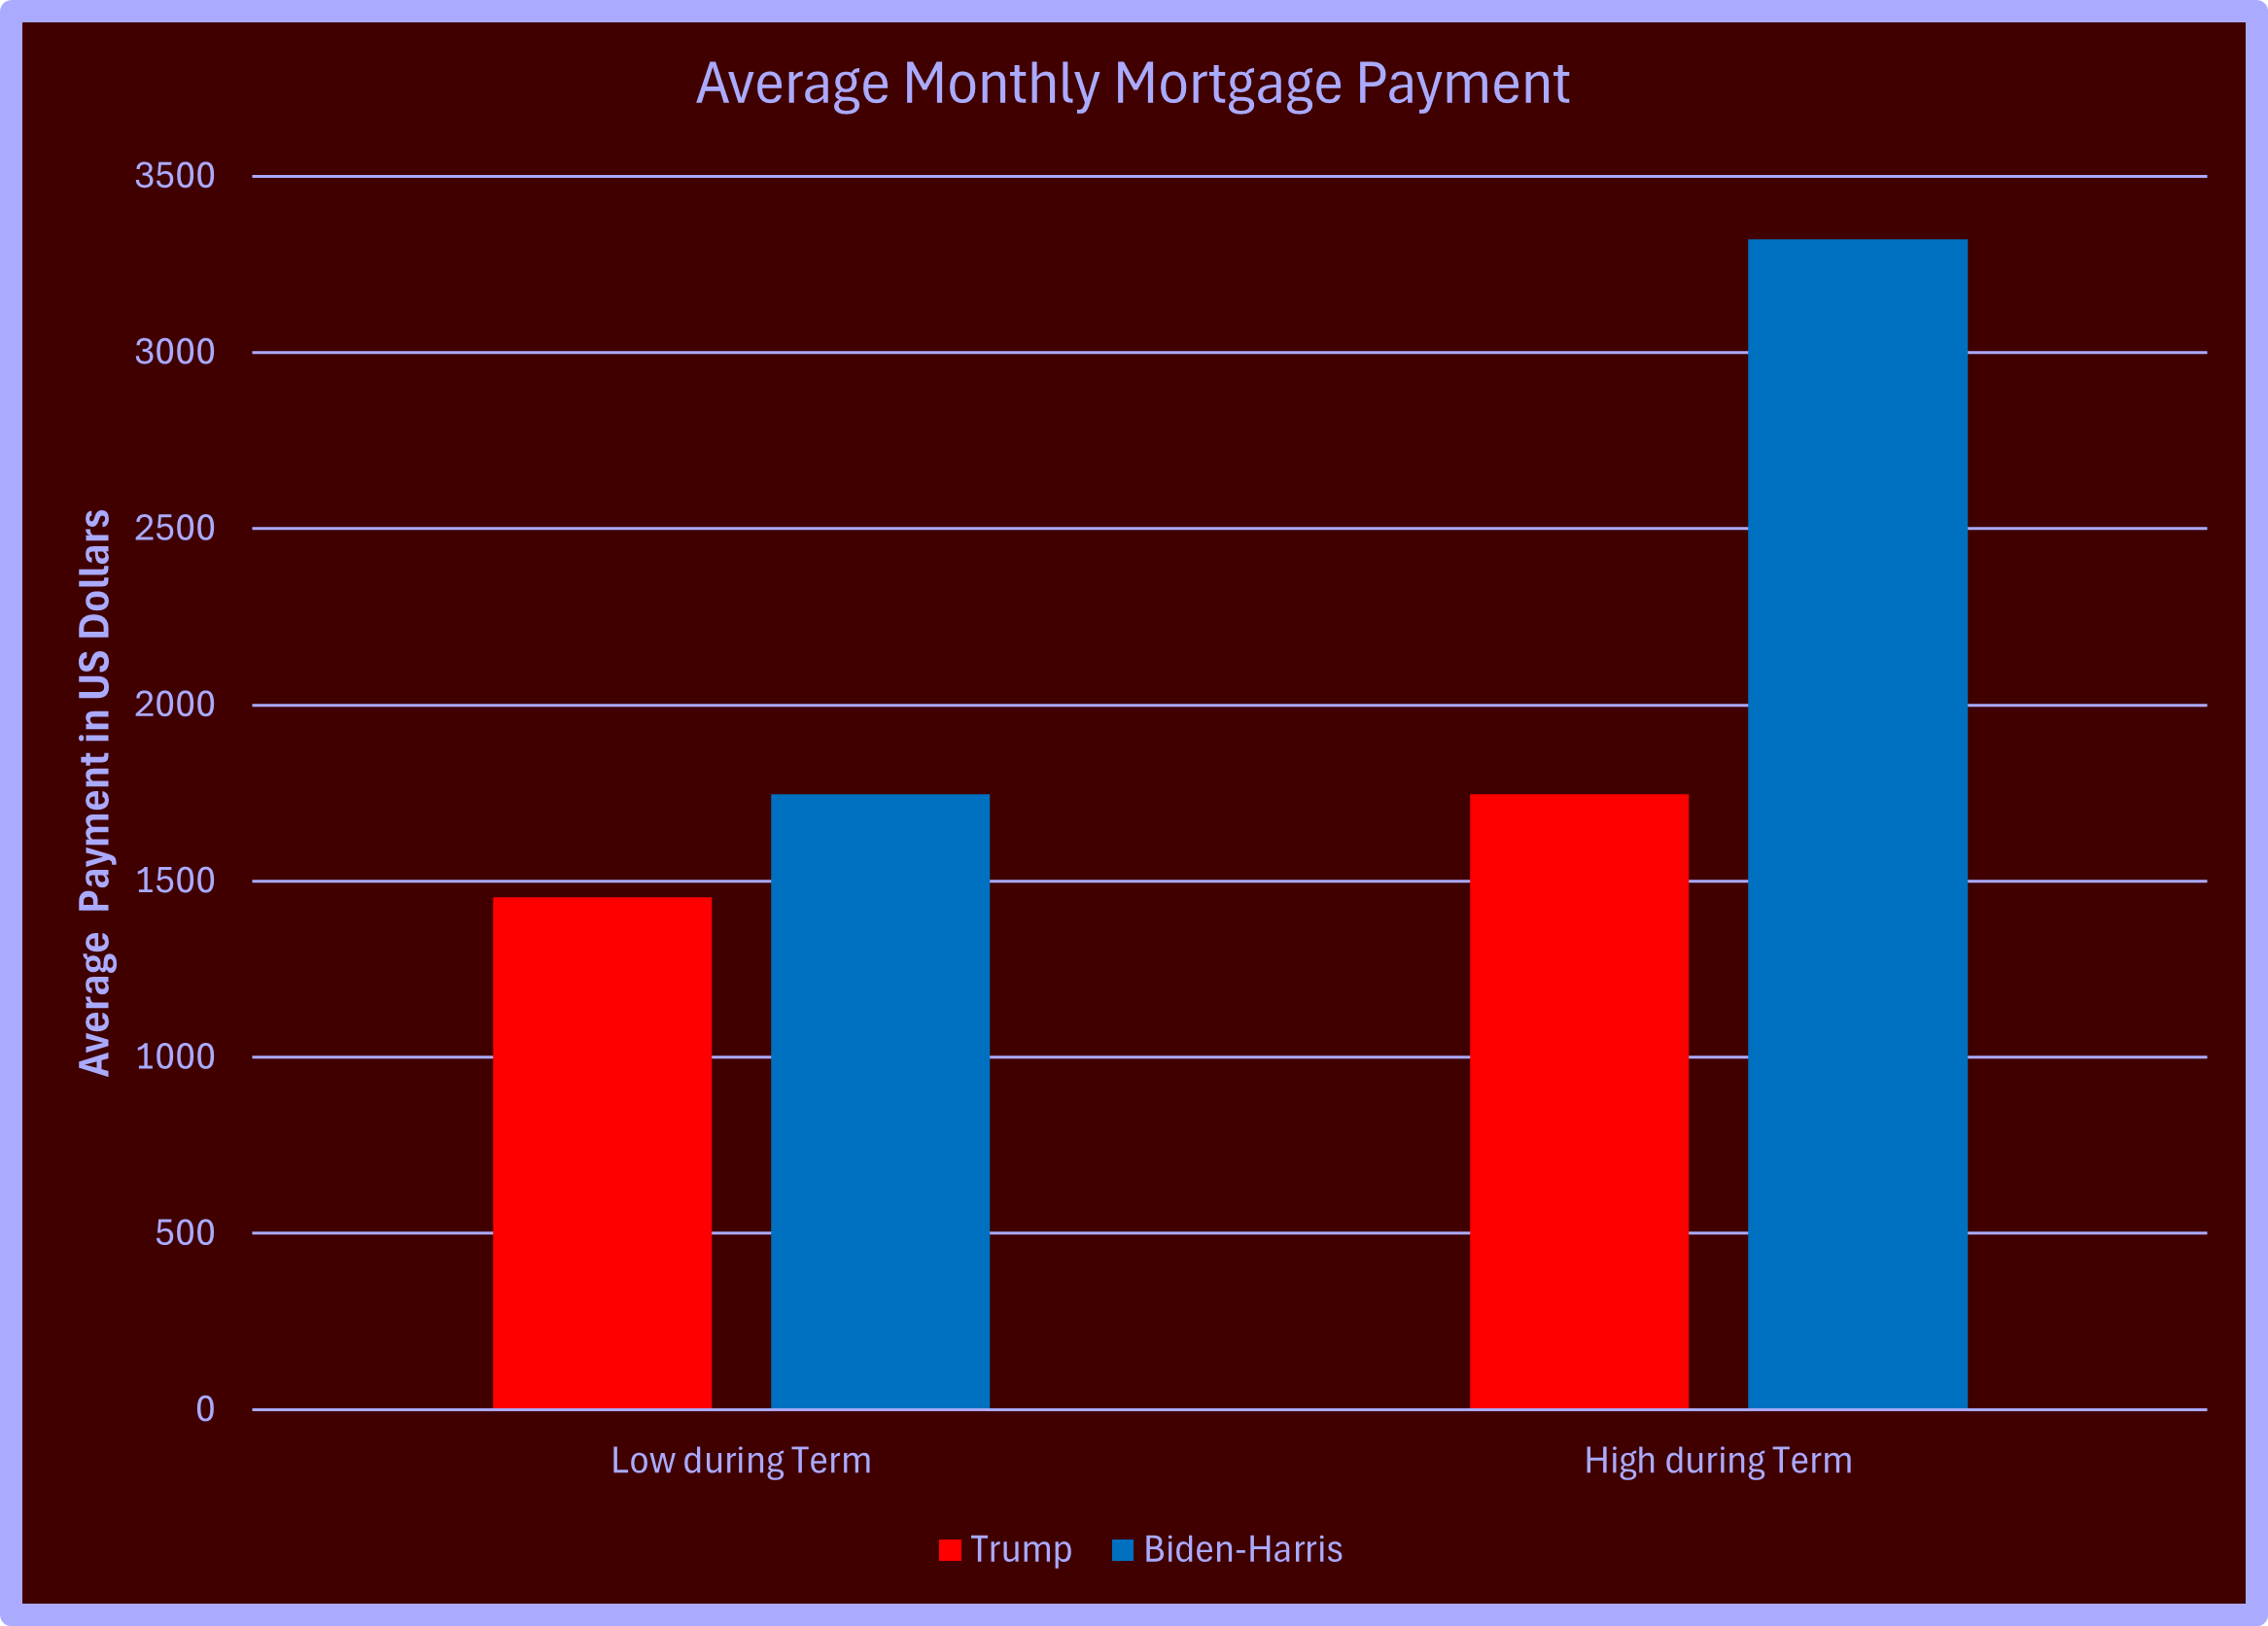
Mortgage payments went up dramatically as well. The payments almost doubled from the highest rate under Trump of $1746 to almost twice as high, $3322, under Biden-Harris.
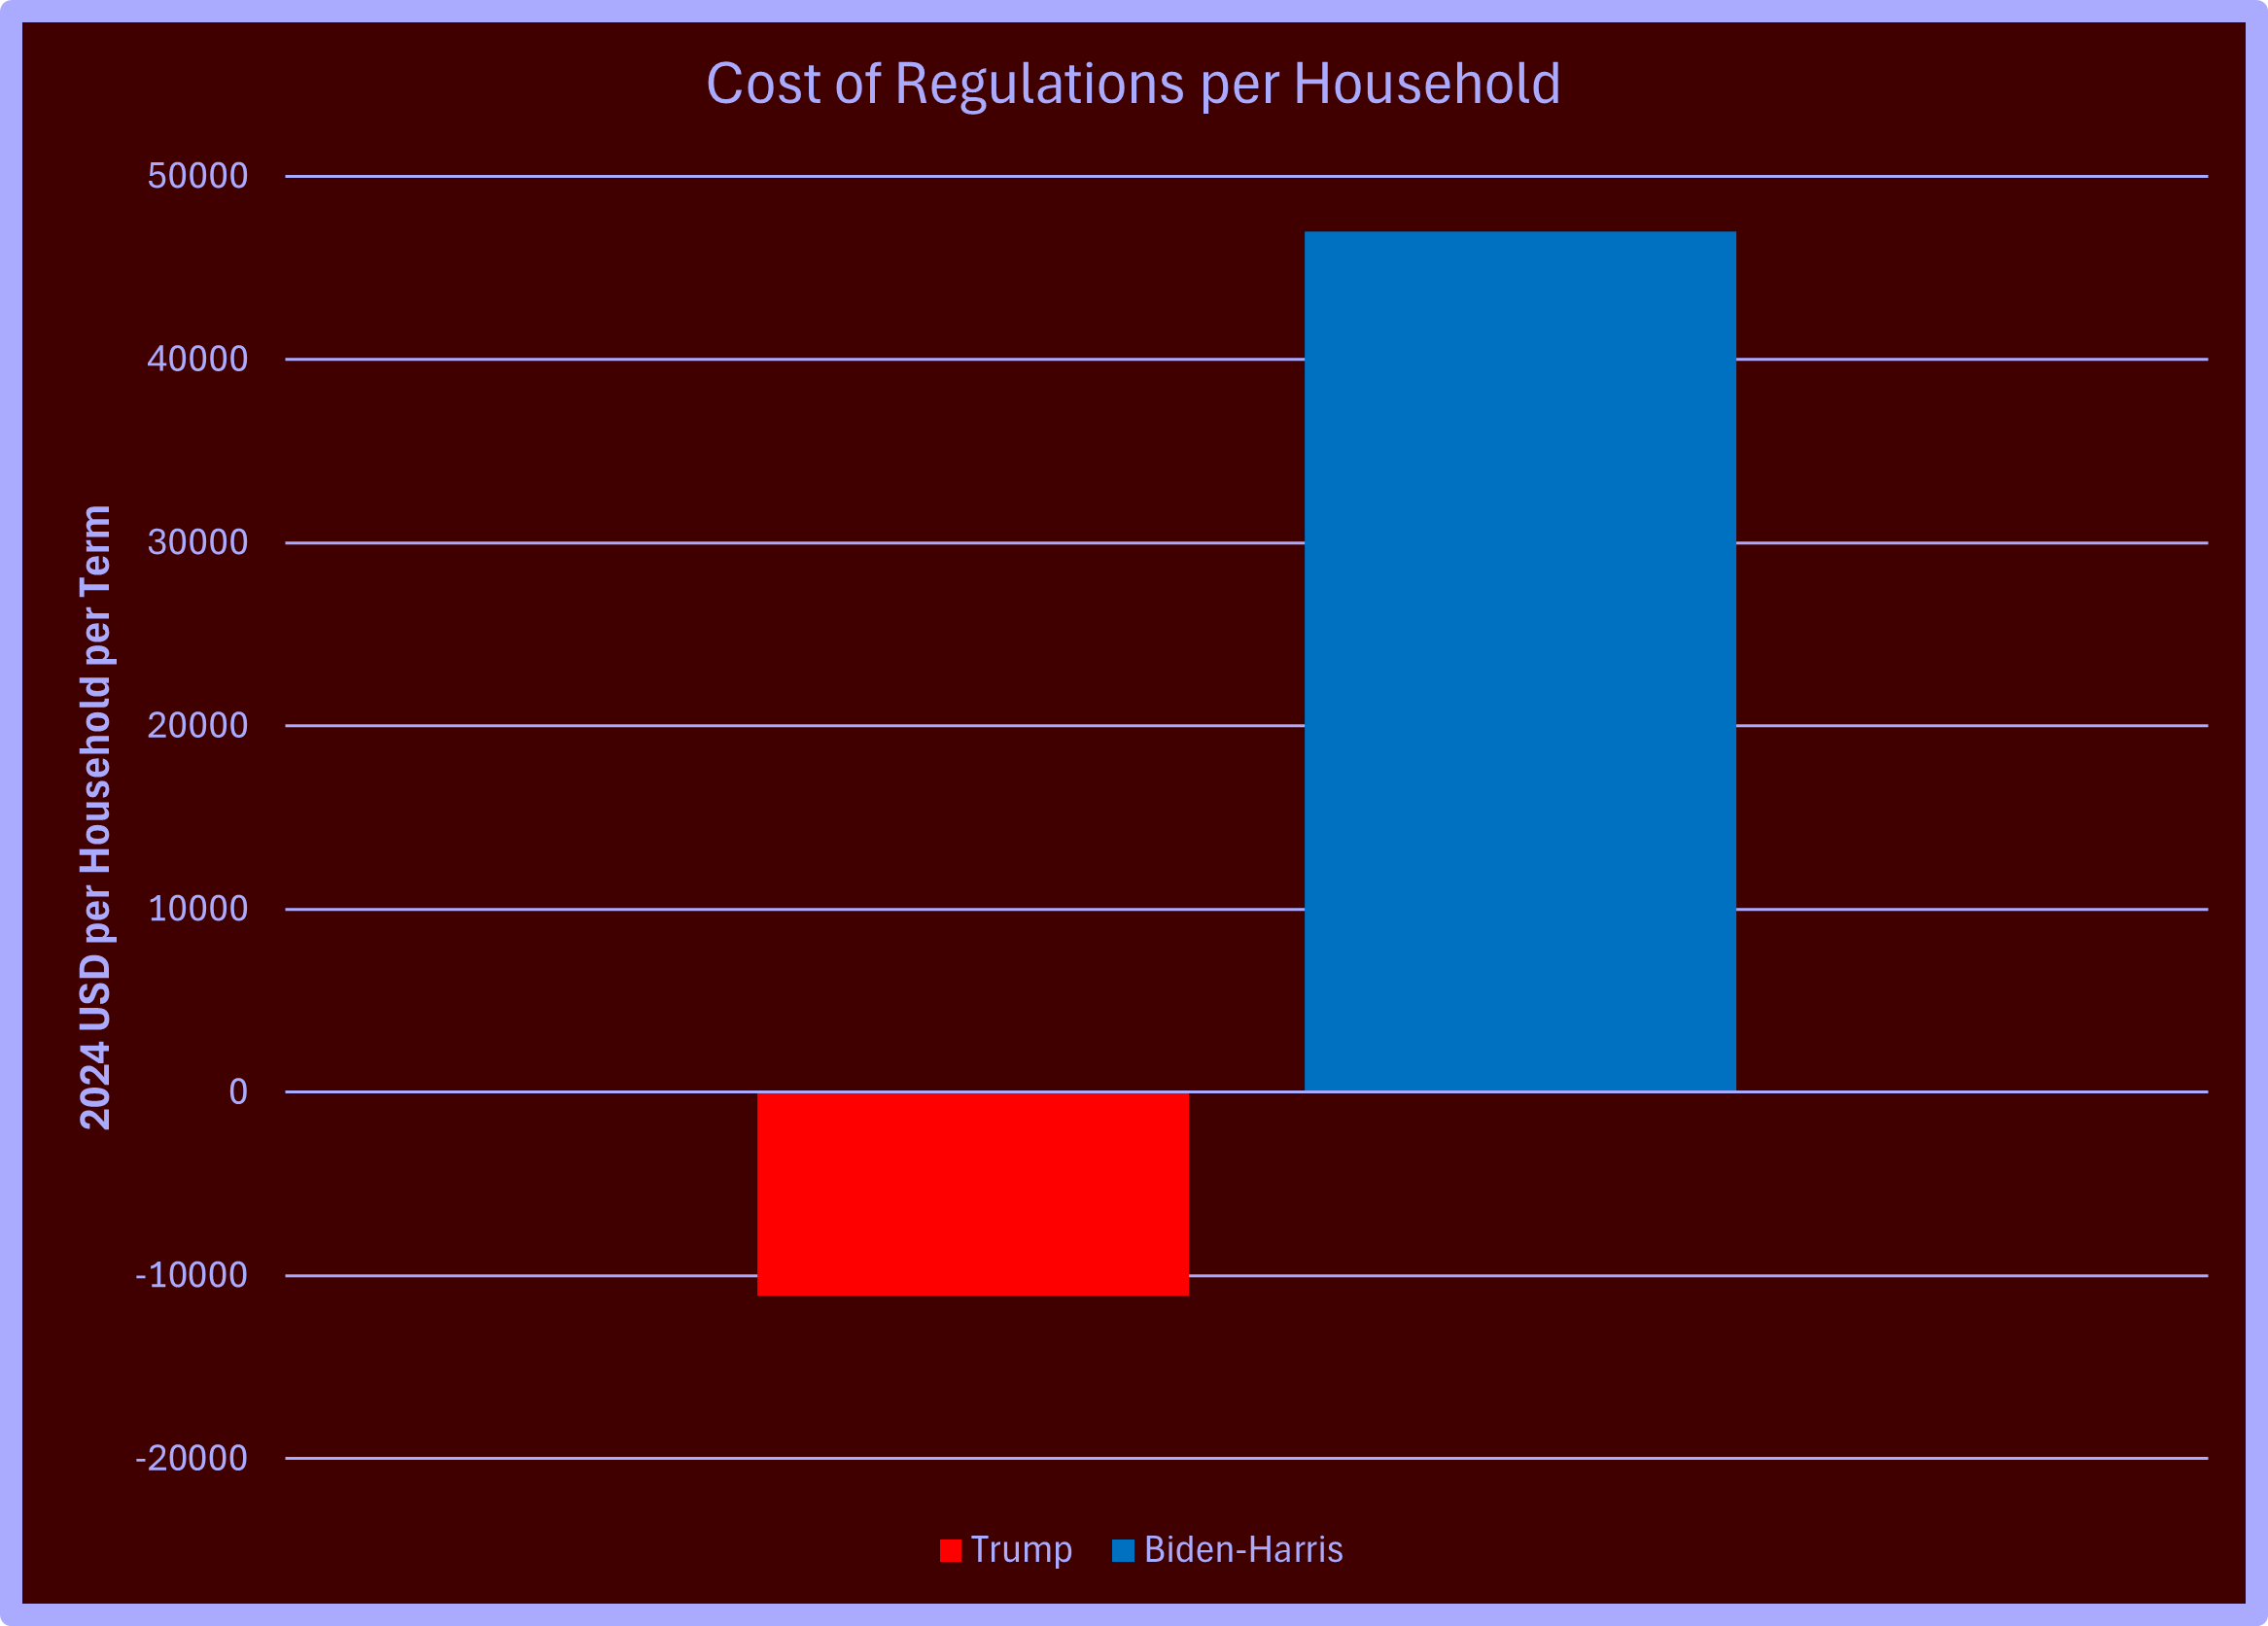
In addition to all these obvious costs, there are hidden costs, most notably the cost imposed by increased government regulations. Trump removed regulations, saving the average household $11,000 during his term, while Biden-Harris increased regulations dramatically, costing the average household $47,000 during their term. Regulations impose hidden costs; for example, requiring businesses to do more paperwork costs the businesses money, so they have to raise prices to pay for it. Every regulation on producers is a hidden tax on consumers.
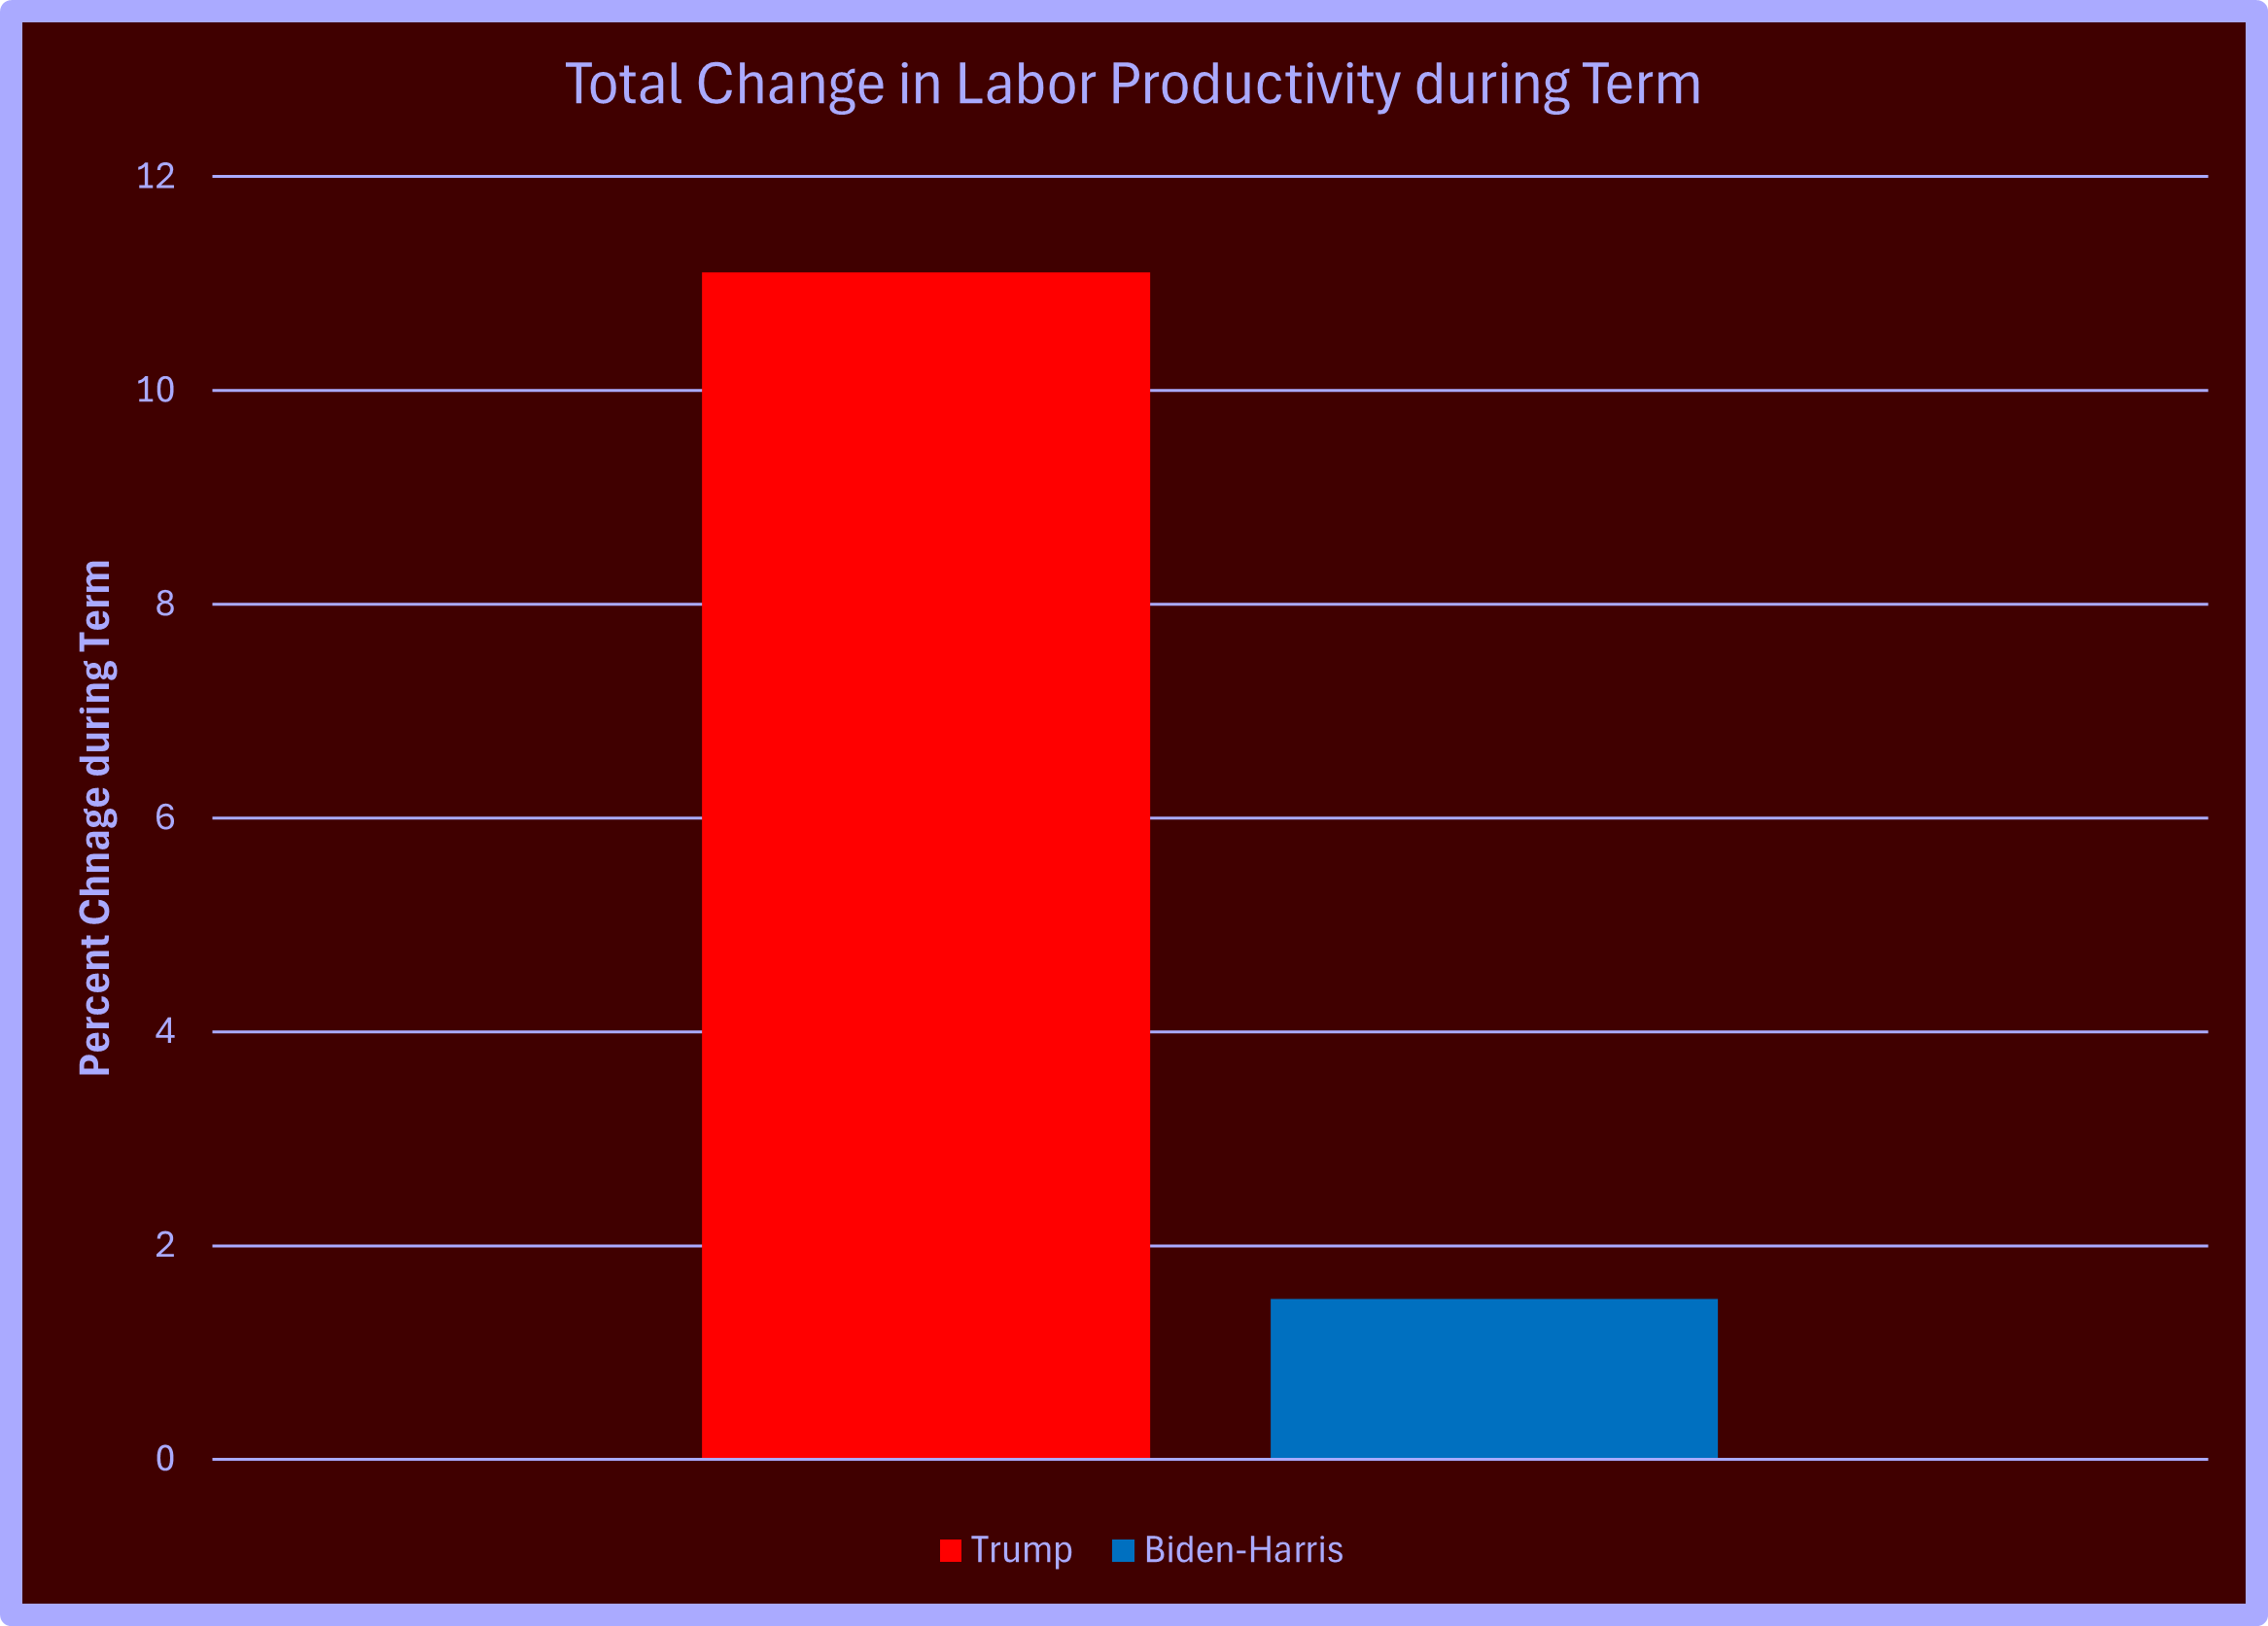
Finally, let's look at labor productivity. Labor is crucial because a less productive workforce means paying more money for less production. Under Trump, the workforce was 640% more productive than under Biden-Harris, a stark contrast that underscores the importance of economic policies in shaping the nation's productivity.
There is no doubt whatsoever that the economy was far, far better under Trump than Biden-Harris. What about the election? The best bet is that the economy under Trump will be much like it was when he was President, and the economy under Harris will likely be very similar to her term as Vice President. As far as what they say they will do, Trump says he will do what he did before again. Harris has proposed several measures that, if implemented, would likely make things worse than they were under Biden-Harris. As you factor the economy into deciding how to cast your vote, it's essential to consider how well you fared under the two administrations but also how well the millions less fortunate than you faired. People vote for candidates for reasons other than economics; you have to decide how important the economy is in your life and the lives of others. Whoever you choose to vote for, please vote; your voice matters.
If you found this article stimulating, please share it with other folks who might enjoy it. And please share your thoughts below. Dr. Cardell would love to hear from you.

Responses
Will Trump be able to bring prices back down?
Short answer: No but he may be able to raise wages to compensate. I'll write an article to answer in-depth soon.