

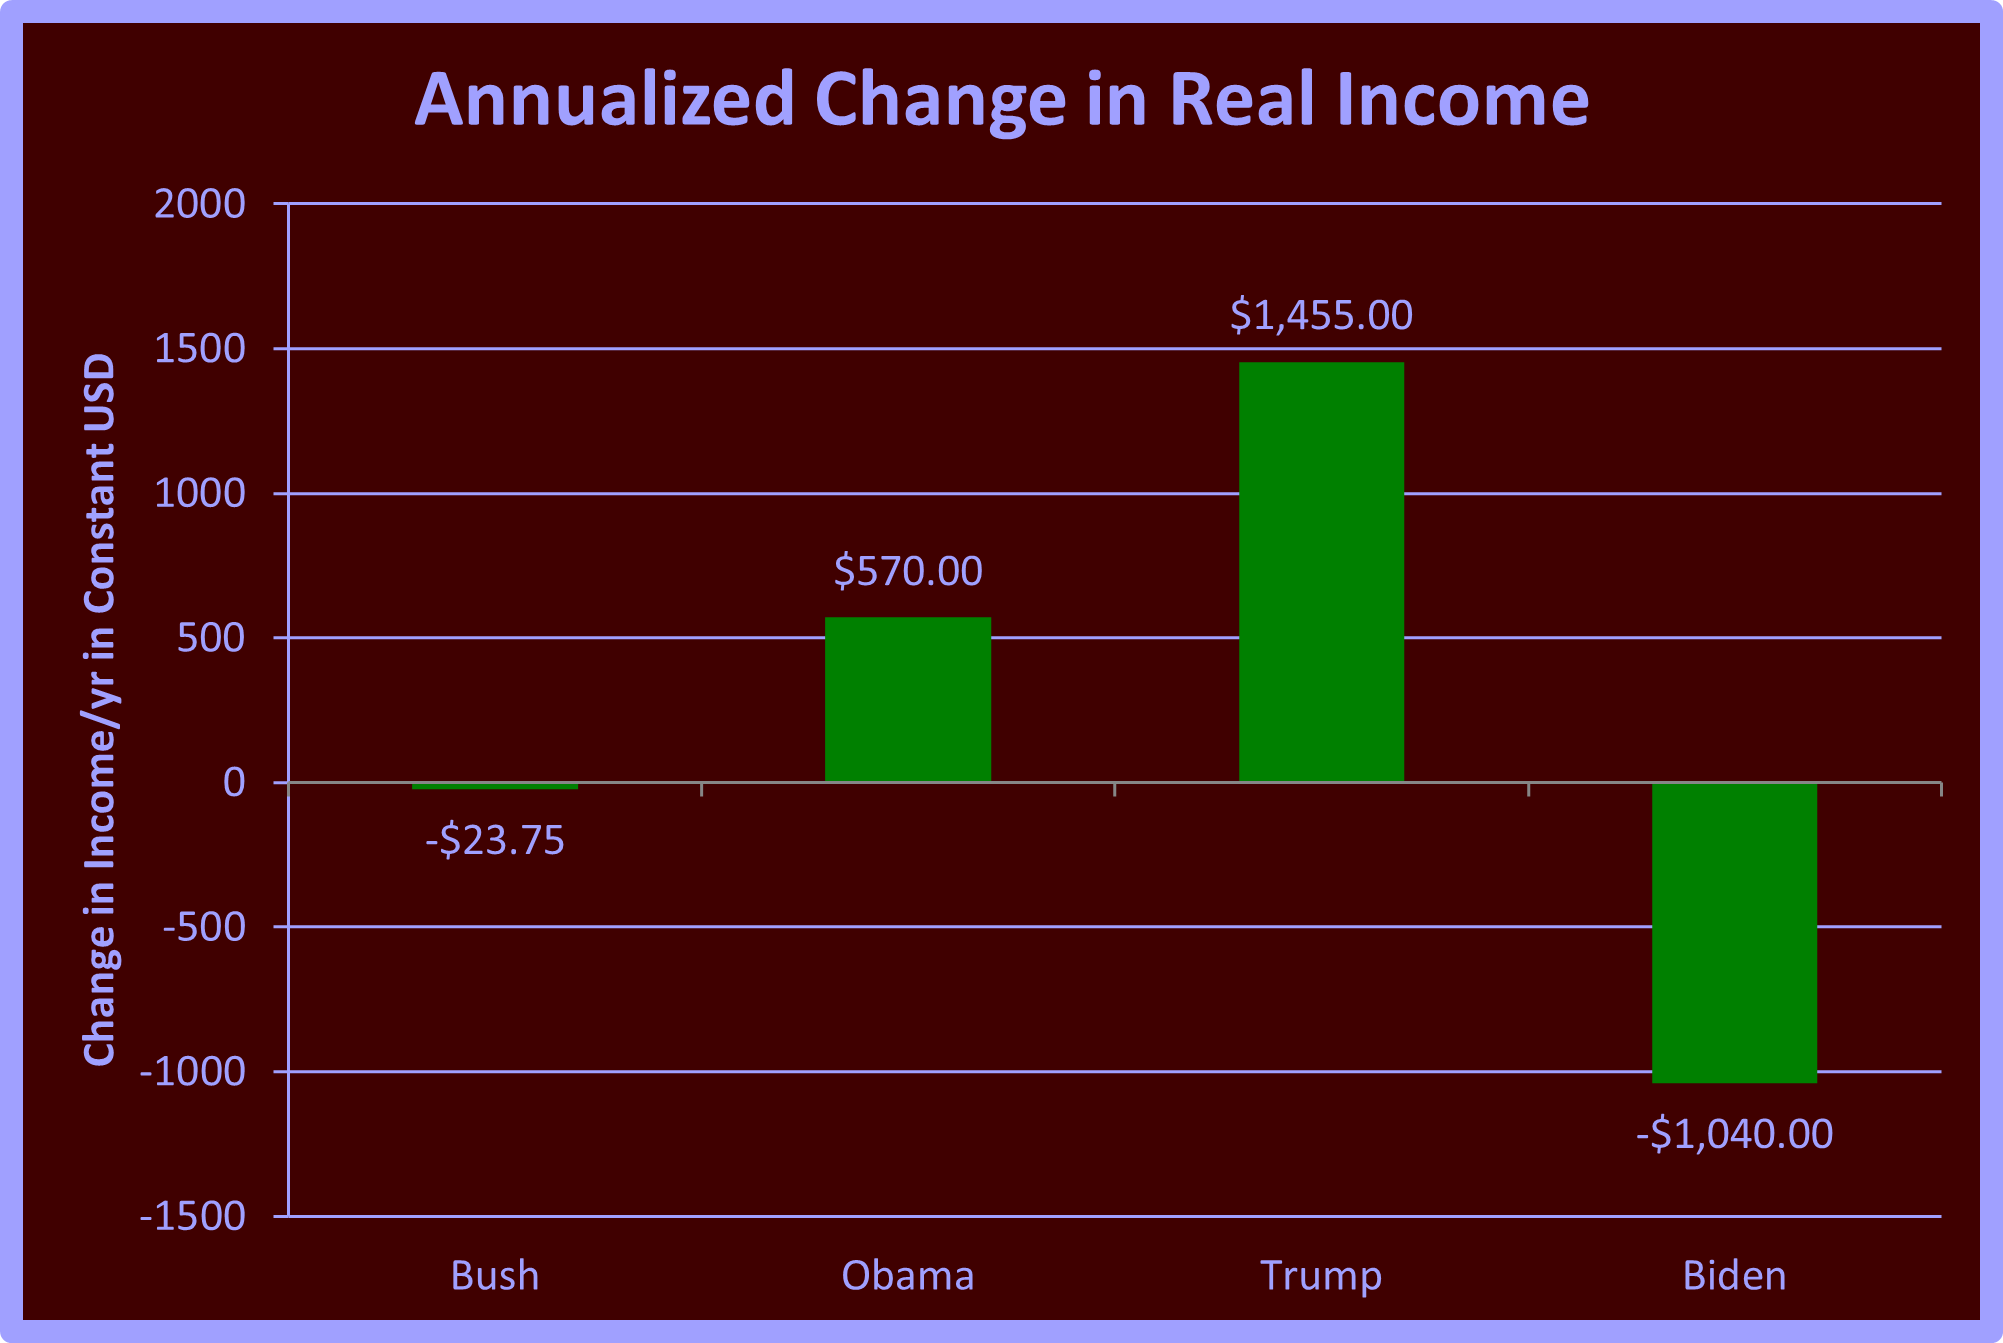
A reader asked, "Of the previous four Presidents, whose economy boosted incomes the most, particularly for minorities." Well, let's find out. The first part of the question is the easiest to answer. President Trump emerges as the clear winner. His economy delivered an astounding income gain, almost three times that of his nearest rival, President Obama. This significant difference in income gains, particularly for minorities, is a key point of our analysis. All amounts are in inflation-adjusted dollars. Presented below is a graph illustrating the annualized income changes under each President from 2001 thru 2022, the last year data was available when this article was written. Annualizing these changes is crucial as it enables a fair comparison, considering the varying durations of their presidencies: Bush, 8; Obama, 8; Trump, 4; and Biden,2. The figures in the chart represent the average gain per year for each year of their presidency. For instance, during President Obama's tenure, the average increase was $570 per year for eight years, totaling $4560. Similarly, during President Trump's term, the average was $1,455 per year for four years, totaling $5820. The combined income gain of the Bush, Obama, and Biden economies over their entire terms of office for 18 years is $2290. This total is less than half of the income gain achieved under the Trump economy in four years, which totaled $5820.
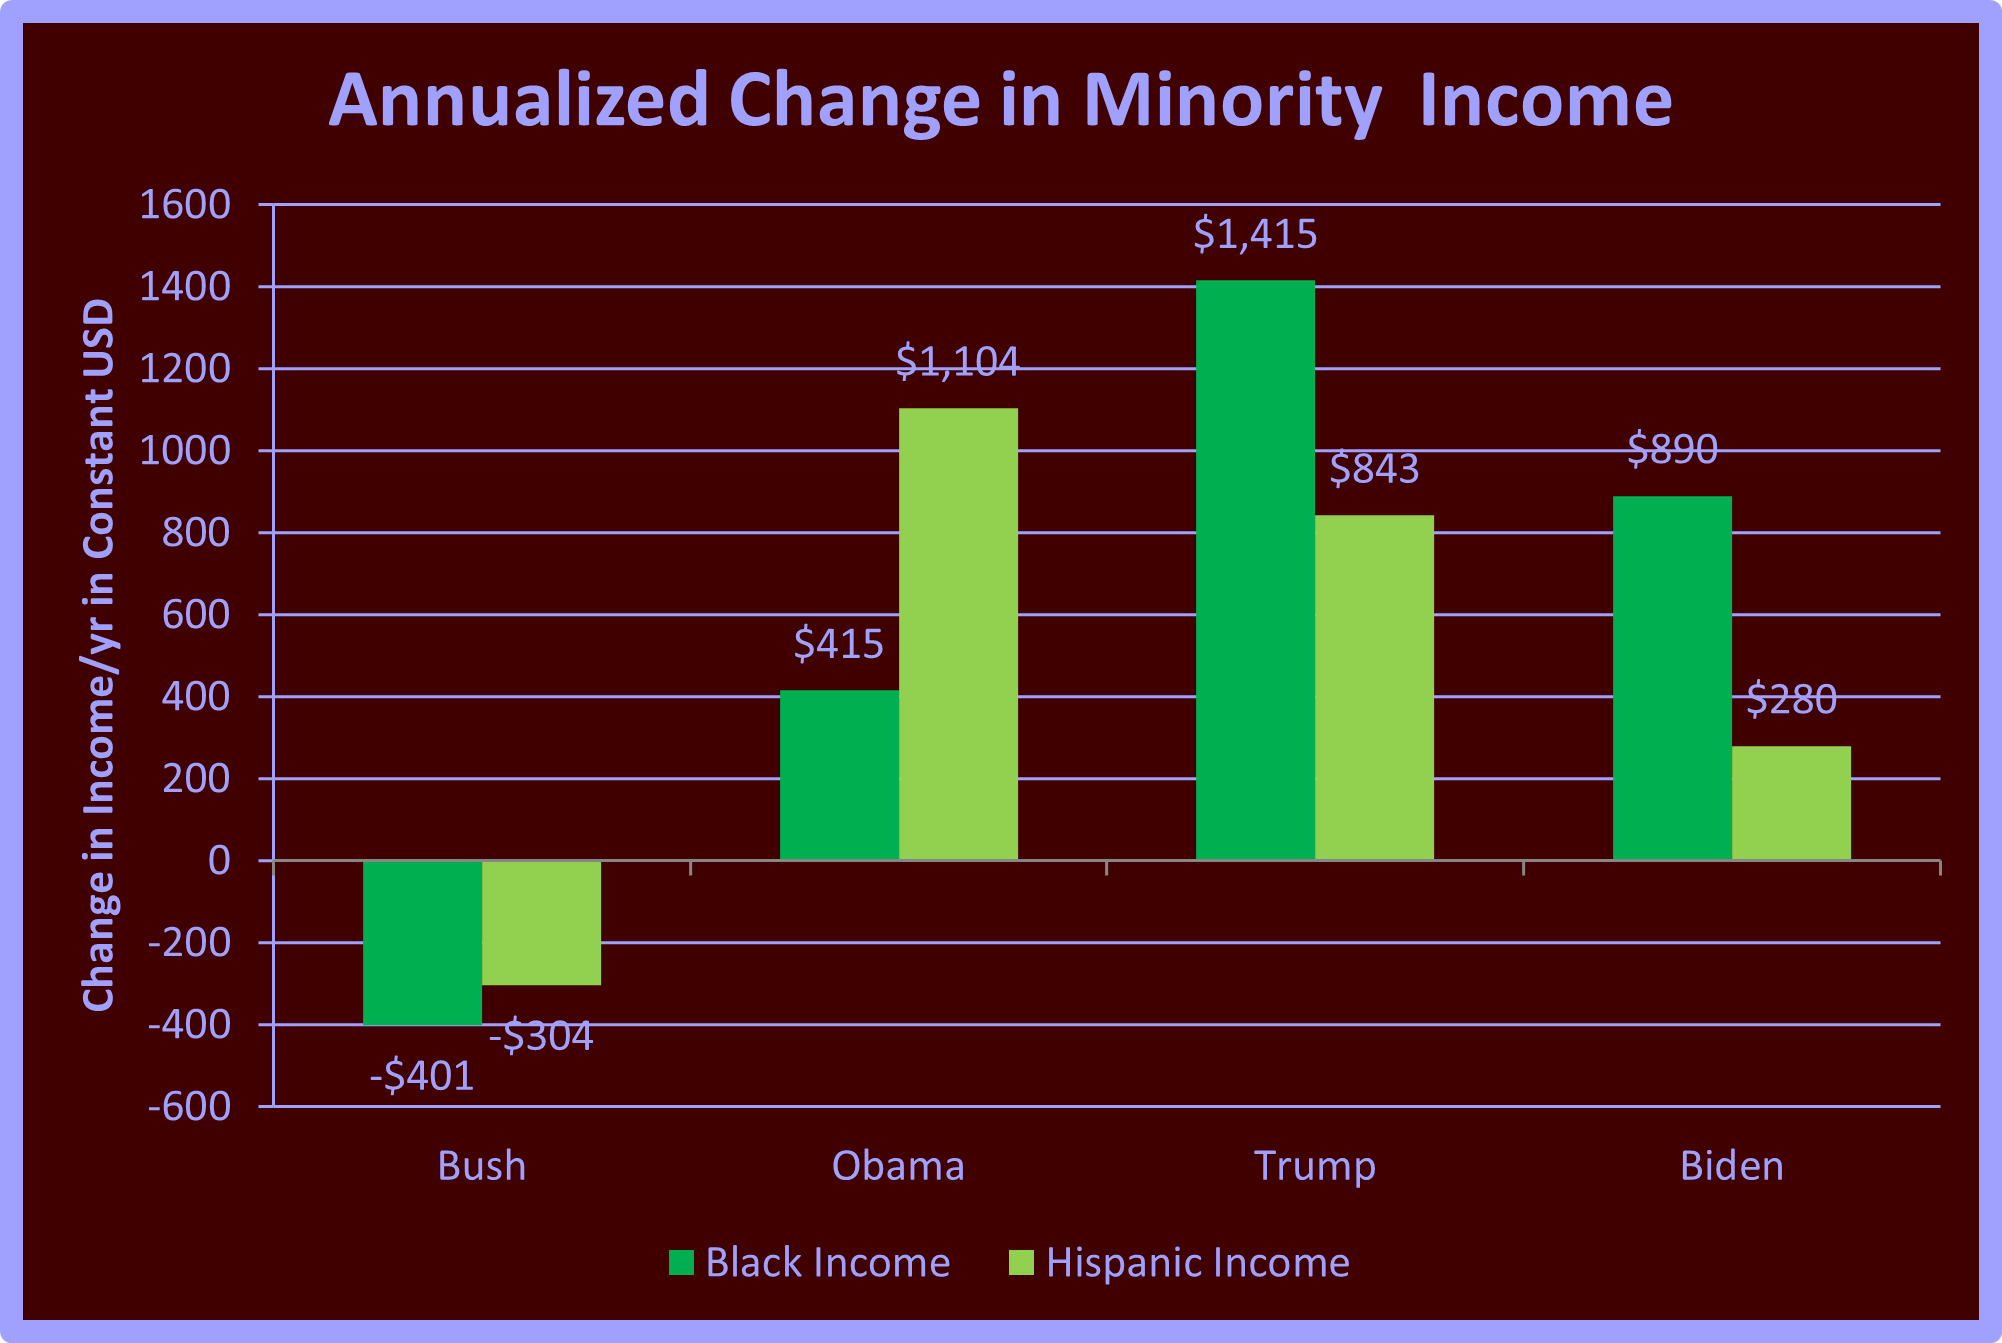
There are two insightful measures of minority differences. The first is the same as above but segmented by race. The other is the change in home ownership, a key indicator of financial success. The first graph below demonstrates that Blacks benefitted significantly more under President Trump. Suppose we calculate the total gain for Blacks by multiplying the annual gain by the years served. In that case, we find that the total during the Trump administration of $5660 is three times the total of the other administrations combined. However, Hispanics fared somewhat better under President Obama. Once again, annualizing the results corrects for different lengths of service.
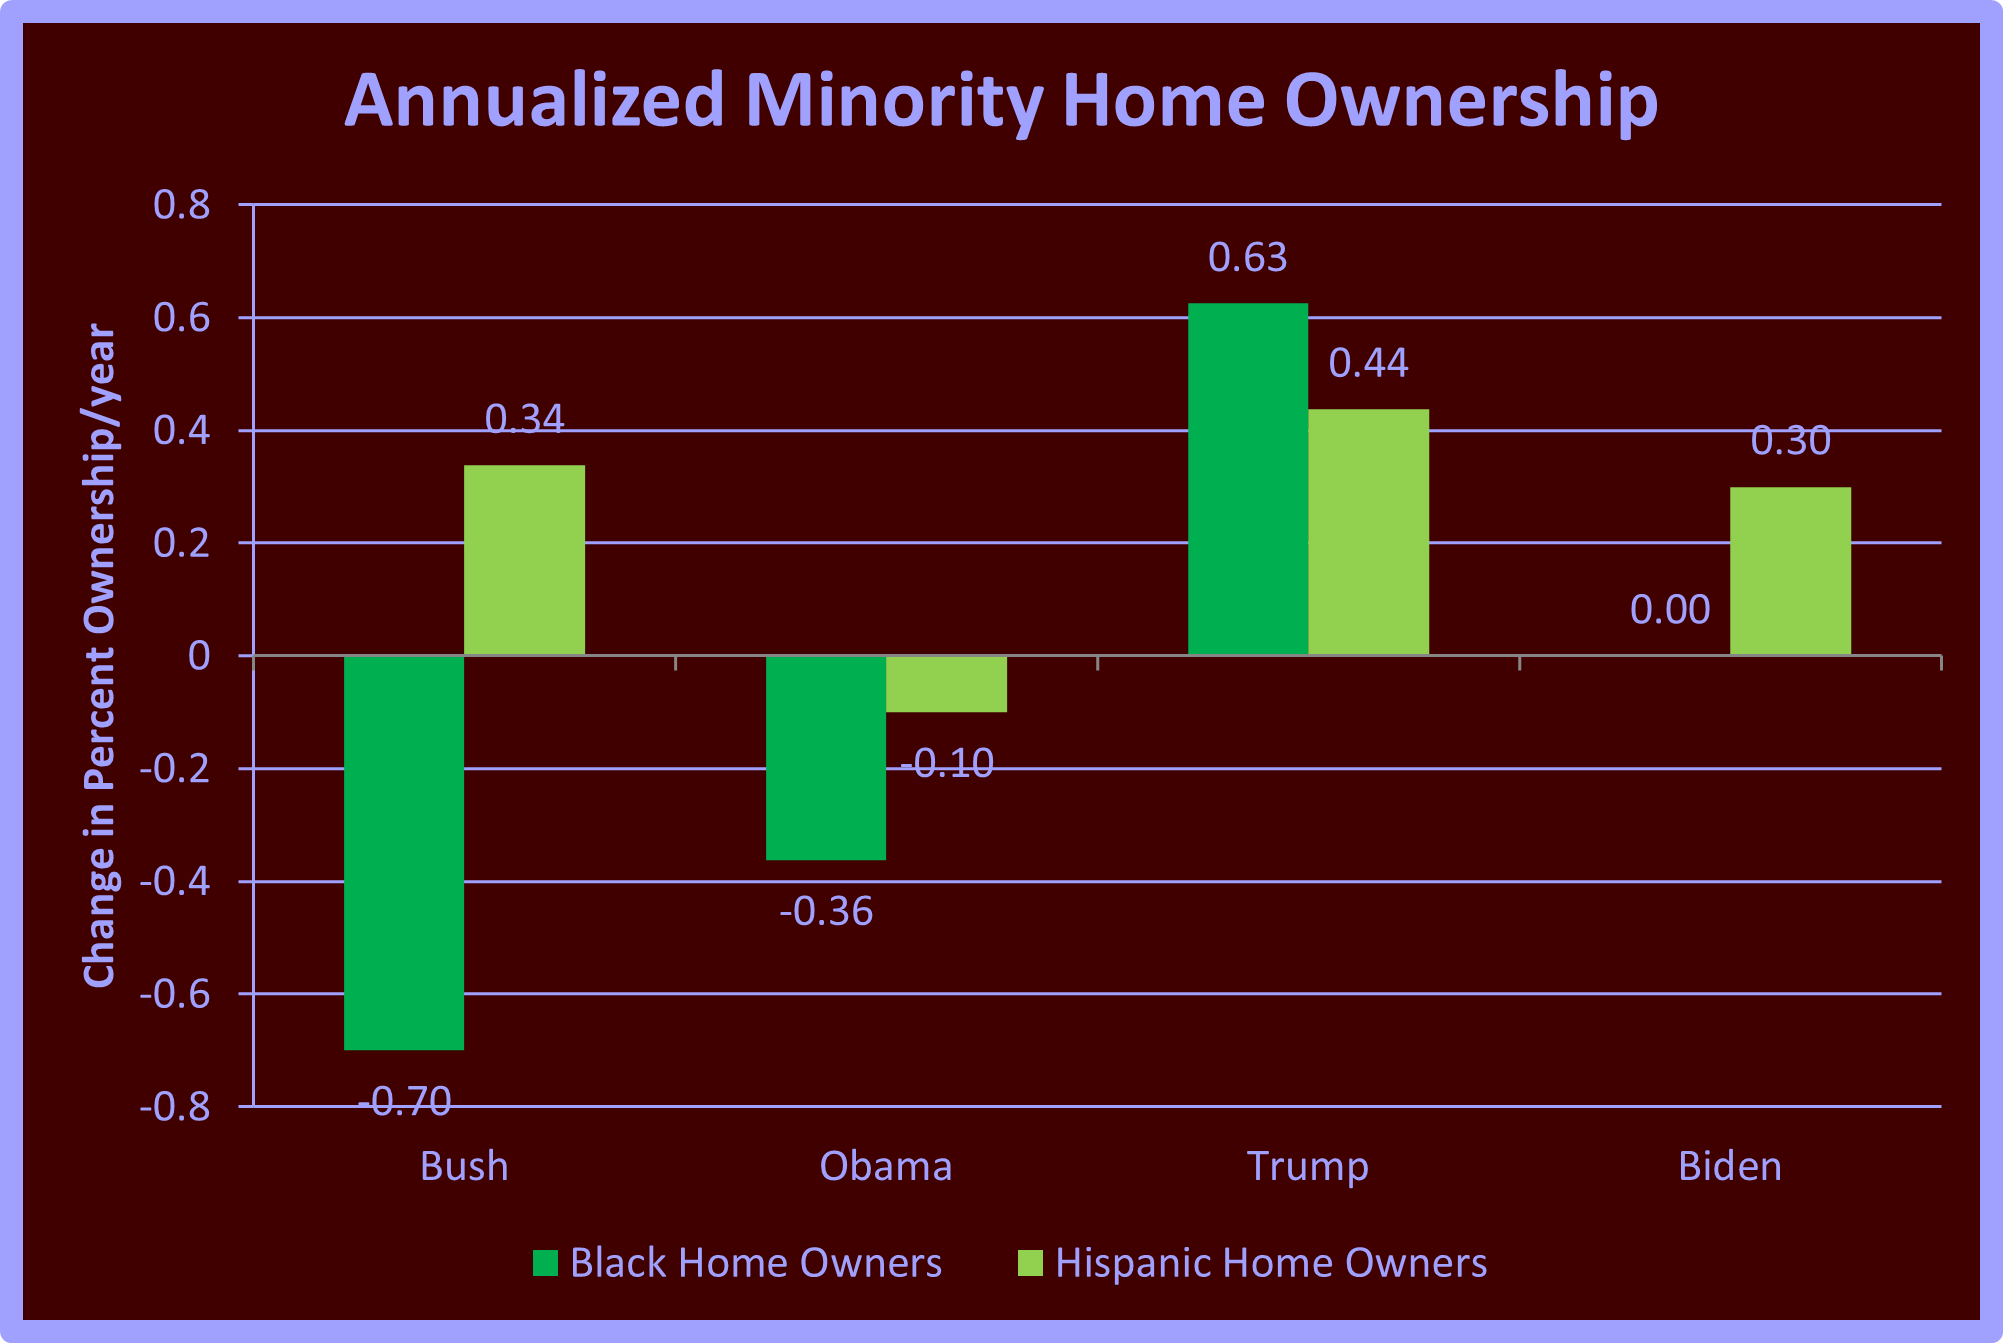
The final graph shows the annualized change in homeownership for Blacks and Hispanics. As you can see, both groups experienced significant improvements under President Trump's economy. However, the difference for Blacks is particularly striking. During the Trump presidency, Blacks increased their homeownership by two and a half percent, while the other three presidents saw a combined decrease of eight and a half percent. Hispanics also had the highest annual gain under President Trump. This data not only highlights the positive impact of President Trump's policies but also points to a potential pathway for positive change in future economic policies.
The evidence is clear: Trump's economy trumps that—sorry, I couldn't resist—of all the presidents of this century, in many cases, all of them combined. In fairness, it's important to note that if we remove the last two years of President Bush's term, before the housing bubble's collapse, which had nothing to do with his policies, his numbers are much better but still not equal to President Trump's.
If you found this article stimulating, please share it with other folks who might enjoy it. And please share your thoughts below. Dr. Cardell would love to hear from you.

Responses