

In my last article, Then & Now Part 1, I addressed the concerns expressed by many young people about the rising costs of higher education and healthcare. In Part 2, I will address their concerns about housing, food costs, and wage rates. Let's start with housing costs. It's true that in inflation-adjusted dollars, housing costs have risen since 1950, but that's only part of the story. It is a severe error in economic thinking to compare price changes without comparing changes in the product. In constant dollars, an average home today costs more than in 1950, but homes have changed dramatically in that time. In 1950 the average home was 983 square feet, while today, they are about 2500 square feet, two and a half times larger. In addition, in 1950, modern central heating was just being introduced, and most homes didn't have it, and central air conditioning was still twenty years away. There are few houses today as small as those in 1950, but there are mobile homes of that size that include central heating and air conditioning that are better built than typical 1950 homes for the same price in inflation-adjusted dollars as a home would have cost in 1950. While I usually avoid using graphs in my quest for simplicity, I think it will be helpful in this case. Below is a graph of housing costs per square foot. As you can see, housing costs per square foot are about the same as seventy years ago. The big jump from 1960 to 1980 was caused by the addition of central air conditioning as a standard feature. Also, about that time, homes began to include dishwashers, washing machines, and dryers in addition to stoves and refrigerators. The increase in 2020 was due to pandemic-related supply-chain issues.

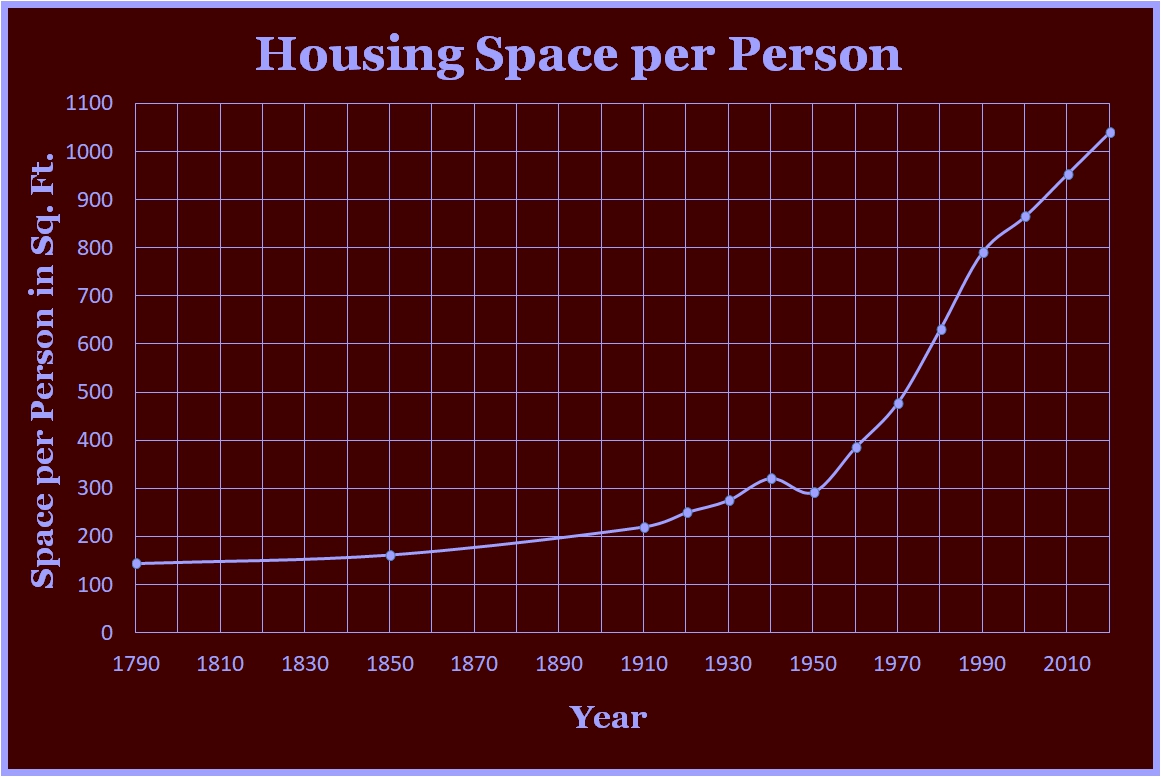
As you can see, folks today have over seven times their personal space in 1790 and over three and a half times their personal space in 1950.
Many young people also believe that inflation-adjusted wages have decreased since 1950. It's not as simple as that. Inflation adjustment cannot be applied to all things equally. The relative value of what the dollar buys changes over time. Since 1790, improved production and distribution have dramatically increased the value of goods. During that same period, advances in tools and technology have also increased the value of labor. However, the value of labor has increased far faster than the value of goods. As a result, an hour's labor will buy more than twenty times the goods it could purchase in 1790. In 1970, the ratio of the value of labor to the value of goods was about five percent; that is, goods were valued twenty times greater than labor because goods were scarce and labor was plentiful. By 1900, the ratio of the value of labor to the value of goods had risen to 20%. By 1950, the labor-to-goods ratio had increased to almost 60%, meaning that goods were slightly less than twice as valuable as labor. Today, the difference has disappeared; we now value goods and labor nearly equally, with labor holding a slight edge. Below is a graph showing the labor value as a percent of goods value over time.

The result of this change in value means that labor today buys almost double the goods it could buy in 1950.
Summing up the Then & Now articles 1 & 2, we found that younger folks have a legitimate concern about the costs of higher education and healthcare. However, those that blame free-market capitalism for causing the problem are misdirecting their anger. The sole blame lies with the federal government injecting itself into the market, and while well-meaning, their economic ignorance created this debacle.
In addition, we found that contrary to popular belief, wages buy far more today than in 1950. They buy far more spacious homes with far more features; they buy computers that cost far less and do far more. They buy appliances that dramatically outperform their sixty or seventy-year-old counterparts. Wages today also buy a wealth of things that save us time and money that didn't even exist fifty years ago: cell phones, flat-screen TVs as much as twenty times the size of those fifty years ago, robotic lawnmowers and floor cleaners, and so much more. All of these innovations save time and money.
The result is that people in the US today live better than people at any time in history, and they are working less to pay for it. In 1830, the typical work week was 70 hours; by 1890, it had shrunk to 60. In 1930 it was 50, it wasn't until 1980 that it finally reached 40, and today it's 38.7 hrs/week, a bit more than half of what it was in 1830. Life today has its challenges, but earning enough to have a good life is not one of them. For even more good news please read my next article in this series, Then & Now Part 3.
If you found this article stimulating, please share it with other folks who might enjoy it. And please share your thoughts below. Dr. Cardell would love to hear from you.

Responses